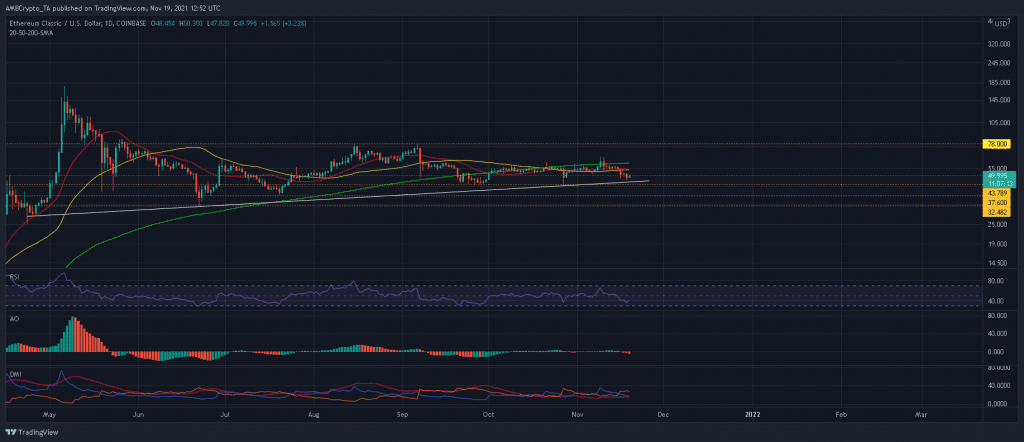
Ethereum Classic sits on the precipice of an additional 30% market decline as bears prepare to turn the screws below the $43.7 support. For the moment, a lower sloping awaited a fourth retest, should ETC fall prey to near-term woes. From there, a small window of opportunity would present itself but ETC would need to break above its MA’s to fully capitalize on its recovery attempt.
Ethereum Classic Daily Chart
Ethereum Classic may not have had an adverse reaction to a wider market sell-off just yet, but it’s worth noting that its price traded below the 20-SMA (red), 50-SMA (yellow) and 200-SMA (green) and faced the threat of short-selling.
Should sellers bust open ETC’s cracks below $43.7 support, the market could see a 16% shakedown to 21 July’s low of $37.67. An extension of these losses could even see ETC test its defenses at $32.4, bringing about a full 30% decline from its press time level.
However, a lower supporting trendline, which has had three points of contacts since April, and a support line of $43.7 buttressed ETC’s near-term trajectory. Some sideways movement could follow over the coming days as bulls attempt to revive momentum. From there, ETC would need to register a convincing close above the confluence of its 20, 50 and 200-SMA’s in order to establish bullish control. Its next major hurdle lay between $78-$84 – a region which ETC has yet to overturn since the crypto crash on 19 May.
Reasoning
ETC’s daily indicators presented a bearish-neutral bias. The Awesome Oscillator flashed red bars and traded slightly below its mid-line, while the Directional Movement Index’s -DI traded above its +DI. These signs indicated that ETC was not primed for an immediate reversal just yet.
However, RSI’s double bottom did instill some hope. A recovery above 60 would help with the introduction of new longs.
Conclusion
Ethereum Classic was exposed to a 30% sell-off should its price weaken below its lower trendline and $43.7 support. The next points of contact would be made at $37.6 and $32.4. However, ETC would expunge many uncertainties should its price flip the abovementioned moving average’s to bullish. A convincing close above $78-$84 would put ETC bulls back in the driver’s seat.


