Disclaimer: The findings of the following analysis are the sole opinions of the writer and should not be considered investment advice.
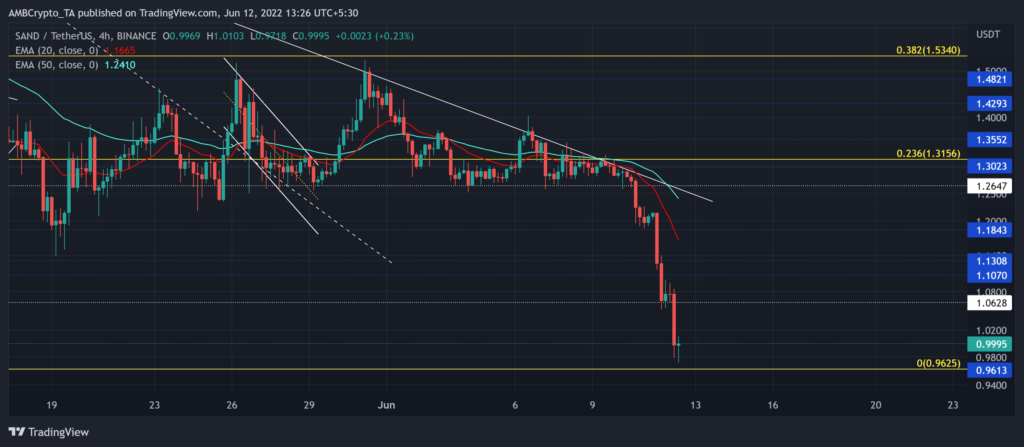
With the sellers clinching another liquidation rally in the Bitcoin market, the ripple effects in the broader market have been quite evident. The fall below the $1.2-mark paved the way for SAND to poke its monthly low at the time of writing.
Post this massive bloodbath, the buyers would aim to stall the heightened sell-offs by provoking a relatively tighter phase.
Any fall below the $0.9625-support would position the alt for an extended downside in the coming sessions. At press time, SAND traded at $0.9995, down by 18.38% in the last 24 hours.
SAND 4-hour Chart
SAND sellers found renewed thrust after reversing from its five-week trendline resistance (white). On its way south, 38.2% and the 23.6% Fibonacci level have kept the buying efforts under the bearish check.
For nearly 16 days, the bears provoked lower troughs while maintaining the $1.2-baaseline. Thus, forming a descending triangle-like structure on the 4-hour timeframe. An over 24% two-day drop from this setup pulled the coin toward its Monthly low on 12 June.
Naturally, the 20 EMA (red) took a south-looking turn again. With the selling volumes marking a substantial uptick, the buyers still had a long way to steer the trend in their favor.
Should the recent bearish engulfing candlesticks pull SAND below the $0.96-mark, the sellers would aim to test its long-term support at the $0.86-level. However, a bullish revival effort could now lead the alt into a rather tight phase in the $0.98-$1.062 range.
Rationale
The RSI has touched its 20-week low at press time and was deep into the oversold region. A likely revival in the coming weeks can position SAND for an eventual bounce-back.
Also, with the CMF approaching its long-term support, the selling pressure could slightly ease. However, unless the Aroon up (yellow) finds a close above 30%, the alt could continue its current sluggish behavior in the days to come.
Conclusion
Given the fall below critical price points and south-looking EMA’s, SAND’s current trend undeniably favored the sellers. But the oversold readings on its technicals can help provoke a squeeze phase.
Finally, the alt shares a 54% 30-day correlation with the king coin. Hence, keeping an eye on Bitcoin’s movement would be vital to complement these technical factors.


