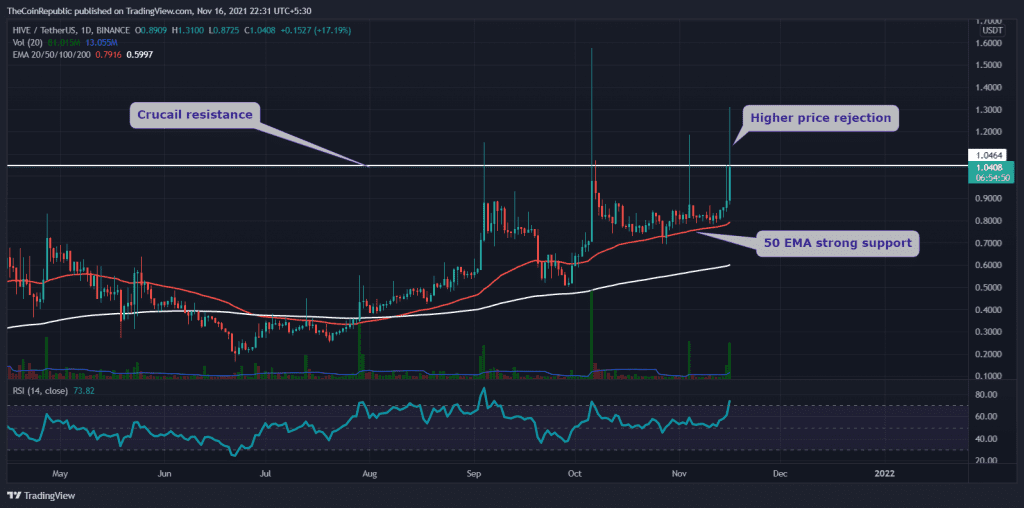
The HIVE/USD chart stated the overall trend for the coin is bullish. However, since March ’21, the token made several attempts to breach the crucial resistance of $1, and till today, it is still struggling to overcome this resistance. Stay tuned to see what happens next.
Key technical points:
- The HIVE coin showed a Cup and Handle pattern in the daily time frame chart
- The 50-da EMA provide strong support to the coin price
- The intraday trading volume in the HIVE coin is $675.8 Million, indicating a 314% hike
Source- HIVE/USD chart by Tradingview
The HIVE technical chart revealed an excellent opportunity for crypto traders when it formed a cup and handle pattern in the daily time chart. The neckline for this pattern was a formidable resistance of the $1 mark, which has previously provided a strong rejection of the coin price.
Today, the coin price showed a sudden surge in its price, making a high of 47% from the day’s low. However, most of this rally is already rejected, and now the chart shows a long wick rejection candle.
The crucial EMAs(20, 50, 100, and 200) suggest the HIVE coin is under a strong uptrend. Moreover, the price is obtaining strong support from the 50 EMA line. The Relative Strength Index value at 73 indicates a bullish sentiment for this coin.
HIVE/USD Chart In The 4-hour Time Frame

Source- HIVE/USD chart by Tradingview
The current price of the HIVE coin is $1.04, with an intraday gain of 17.2%. Thus, at the press time, the token price is still trying to sustain above the $1 mark, and therefore, the crypto traders are suggested to wait for the closing of today’s daily candle before entering with a new position.
The MACD indicator lines are moving above the neutral zone, indicating a bullish momentum for this token.
.
.


