Disclaimer: The findings of the following analysis are the sole opinions of the writer and should not be considered investment advice.
- Shiba Inu jumped above its 20/50 day moving average, can the buyers continue to induce gains?
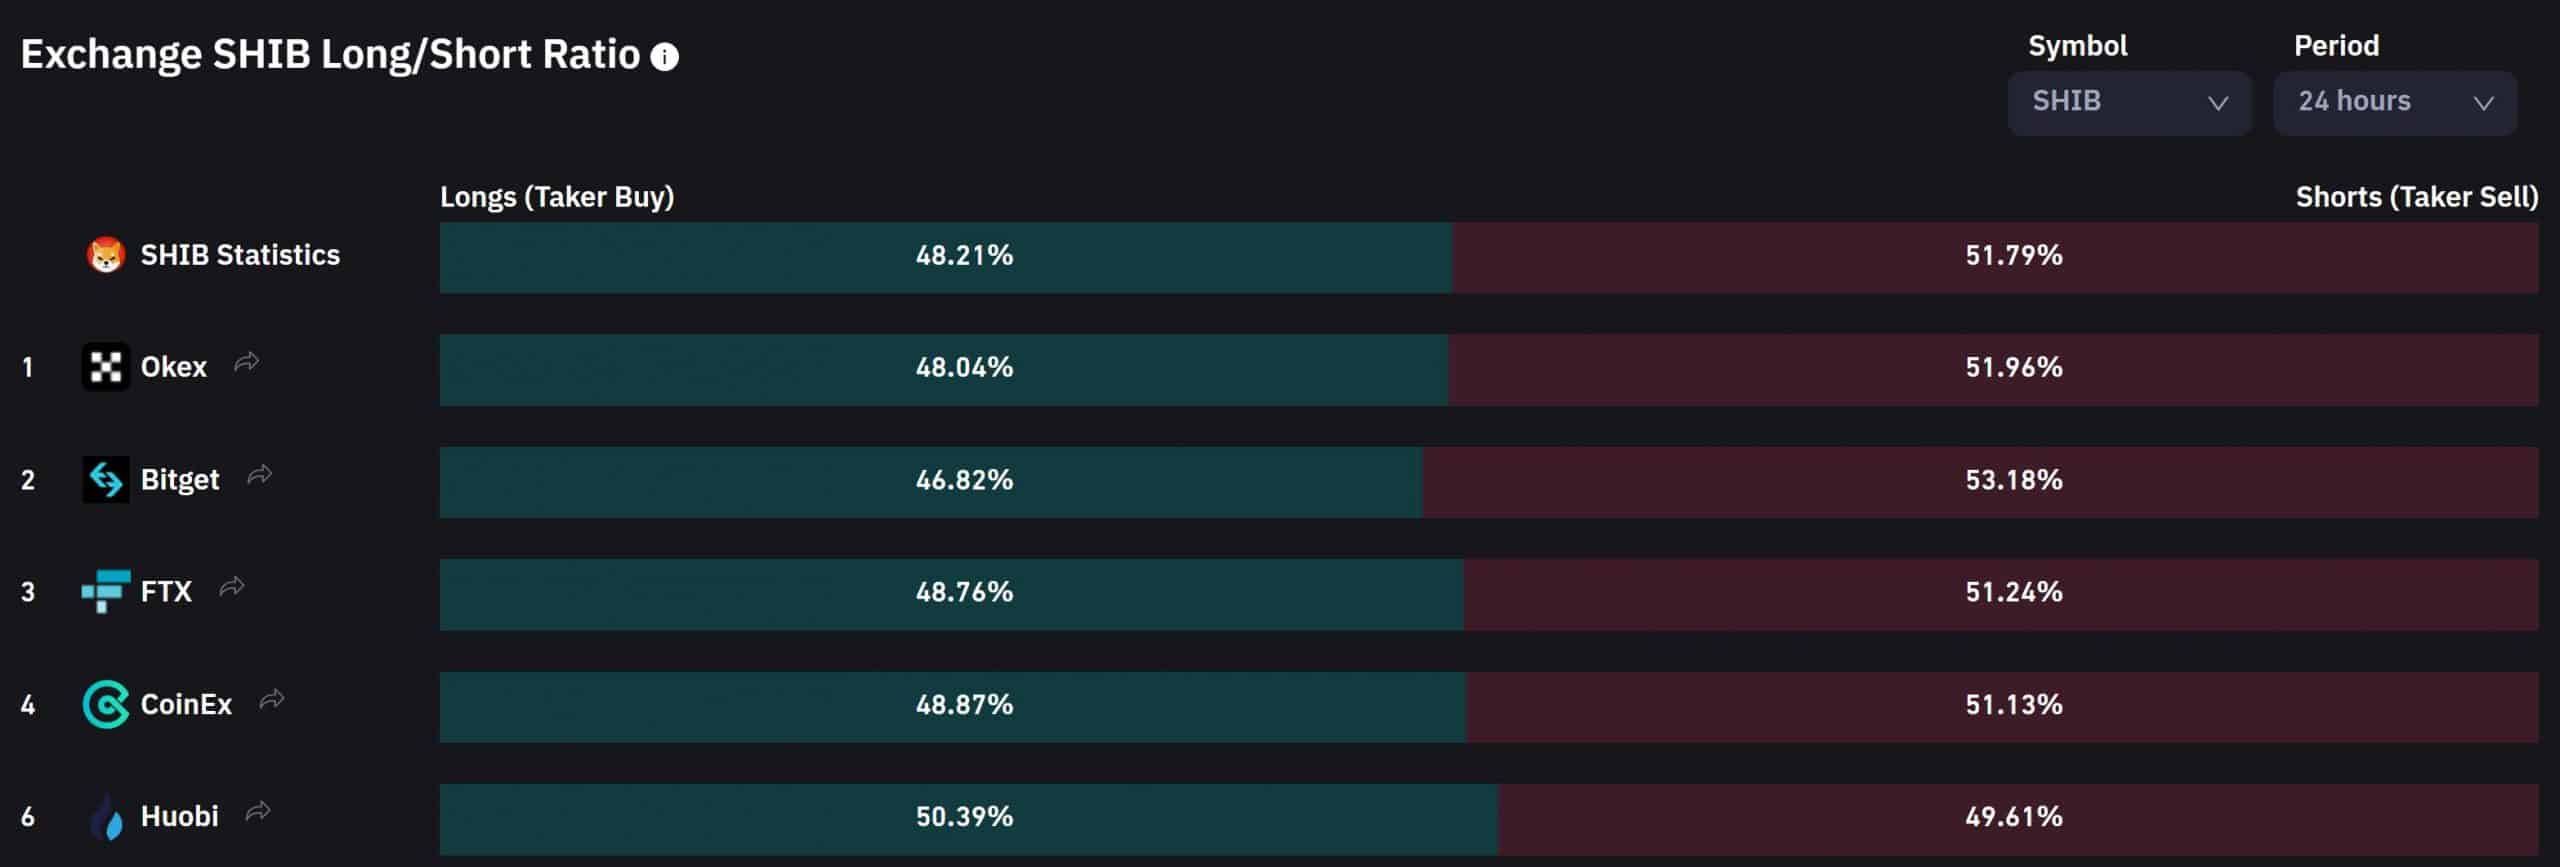
- The meme crypto’s long/short ratio over the past day hinted at a bearish edge.
(For brevity, SHIB prices are multiplied by 1,000 from here on).
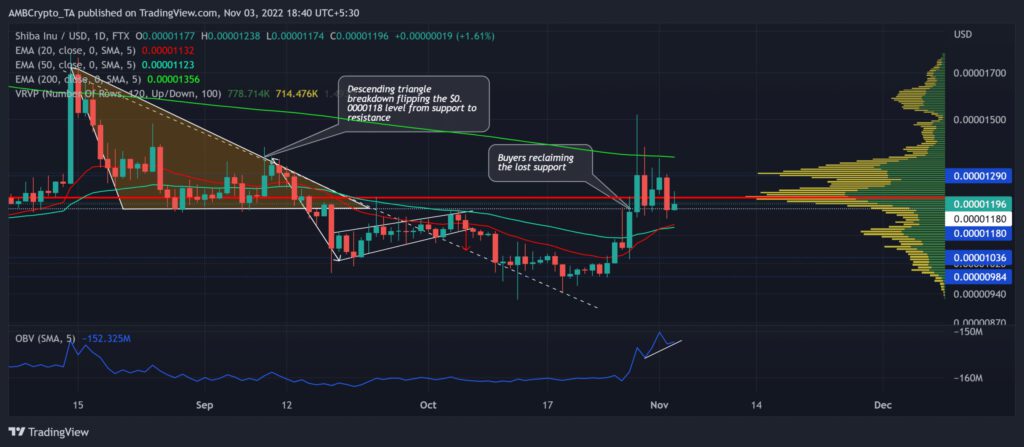
Shiba Inu [SHIB] noted a solid bullish rebuttal as it reversed from the $0.00984 support level in late October. This bullish move pushed the meme token toward its high liquidity zone near the Point of Control (POC, red) in the $0.0122-zone.
Here’s AMBCrypto’s price prediction for Shiba Inu [SHIB] for 2023-24
The bullish resurgence propelled the 20 EMA (red) above the 50 EMA (cyan). The $0.0118 support could now play a vital role in gauging the token’s rebounding chances. At press time, SHIB traded at $0.01196.
Can the $0.0118 baseline support bullish endeavors?
SHIB’s rebound from its long-term trendline support (white, dashed) aided the buyers in propelling a highly volatile phase while clinching double-digit gains.
The token’s recent revival chalked out a bullish flag-like structure on the daily timeframe. After a firm rejection of lower prices near the $0.00984-mark, SHIB jumped above its 20/50 EMA to unveil a near-term buying edge.
While the 20/50 EMAs undertook a golden cross, the buyers could continue to control the near-term trend if they manage to prevent a bearish crossover.
A rebound from the $0.0118-mark could induce a buying comeback. In this case, the $0.0129-mark could be the first major resistance level for the buyers to test.
An immediate or eventual close above the $0.0118-mark can induce a short-term downside for the token. Any decline below the 20/50 EMA would confirm a bullish invalidation.
Furthermore, the OBV noted higher troughs over the last four days. This trajectory bullishly diverged with the price action.
The long/short ratio revealed this
An analysis of the SHIB’s long/short ratio across acc exchanges revealed a slight bearish advantage over the past day. Additionally, the token’s Open Interest also plunged alongside a slight decrease in its 24-hour price. These readings entailed a bearish sign for the near term.
Should the sellers capitalize on this, any break below the immediate support could delay the chances of a solid bull run.
Also, the alt shared an 86% 30-day correlation with Bitcoin. Thus, keeping an eye on Bitcoin’s movement with the overall market sentiment could be essential to identify any bullish invalidations.


