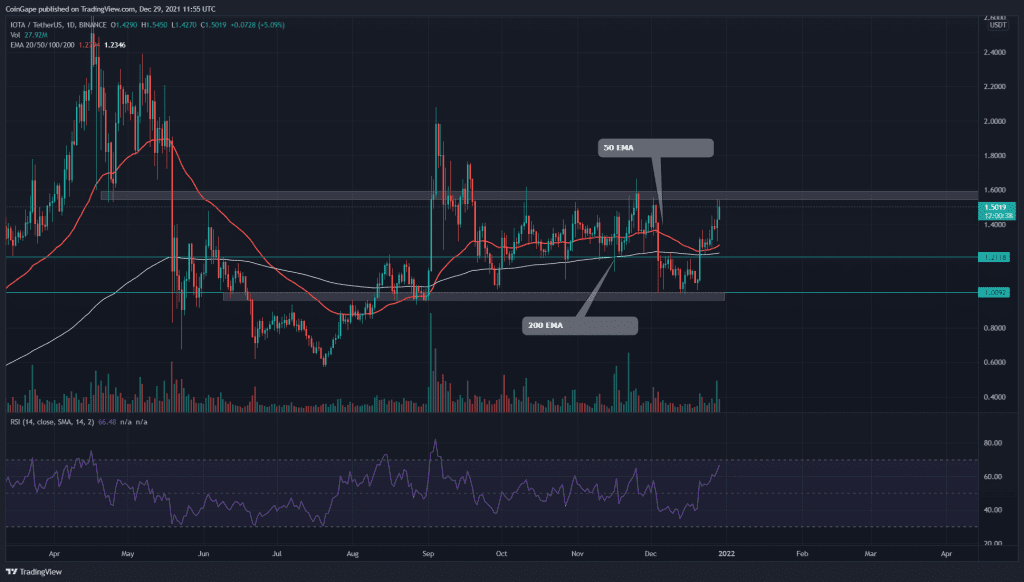
The IOTA coin has been wavering in range for more than three months. After its recent bullish reversal from $1 support, the price has again approached the $1.6 resistance with the hope of a bullish breakout and a new rally.
IOTA Key technical points
- The MIOTA coin price jumps above the 50-and-200-day EMA
- The intraday trading volume in the MIOTA coin is $294 Million, indicating 94.5% gain.
Source- Tradingview
The last time we covered an article on IOTA, the pair resonated in a daily-symmetrical triangle pattern. The coin gave an upside breakout from the descending trendline, hinting at an excellent bullish opportunity for traders.
However, the price could never overcome the $1.6 resistance, and intense selling pressure in the market dropped the price back to the bottom support of the $1 mark. The price acquired strong support from this level and completing a triple bottom pattern the rallied to the above level of $16
The sideways rally in MIOTA price has flattened the crucial EMAs level. However, as for now, the price is above the 50 and 200 EMA, indicating the bullish trend.
A significant recovery in the Relative Strength Index(64) supports the bullish sentiment in this coin.
MIOTA Coin Trapped In A Definite Range
Source- MIOTA/USD chart by Tradingview
The technical chart of the IOTA coin shows round bound movement in its price. This pair has been wobbling between the $1.6 and $1 mark for quite a while now. The crypto traders can expect a good rally in this coin once its breaches from either level of this range.
The coin is currently aiming to retest the resistance zone at $1.6. The long position seekers should wait for a breakout before entering the market. On a contrary note, rejection from the overhead resistance could plummet the price back to $1 support.
The important levels for the coin on the upside are at $1.6, followed by the $1.77. And, on the lower side, the support levels are at $1.21 and $1.


