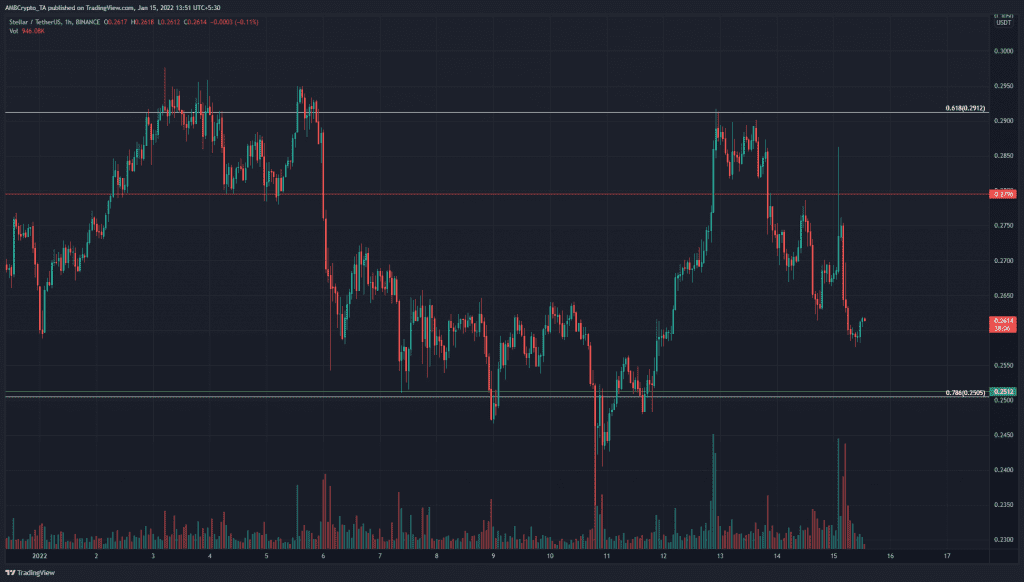
Over the past week, Stellar Lumens has bounced between the $0.291 area and the $0.25 area. This was not a perfect range, but contextually a range was what made more sense. At the time of writing, the price was once more at the $0.26 pocket of liquidity. A close below $0.255 would likely see Stellar Lumens revisit the $0.245 area.
Source: XLM/USDT on TradingView
It has already been pointed out that the price wasn’t in a perfect range. In fact, on the 4-hour chart, the past two weeks of price action resembled more of a descending broadening wedge. Before this, for most of December, XLM was trading at the $0.25 level, forming a rounded bottom that it has revisited in the past week.
A broadening wedge pattern signals either continuation or reversal, based on the context, in a trending market. XLM has not been trending recently, but rather, ranging.
Hence, the $0.24-$0.25 area can be a buying opportunity, with $0.279 and $0.291 as take-profit targets.
Rationale

Source: XLM/USDT on TradingView
The DMI showed no strong trend was in progress as the ADX (yellow) was below 20. The RSI was moving below neutral 50, which indicated bearish momentum was present. The RSI made a higher low in recent hours, even as the price made a lower low. This could see XLM bounce from the $0.26 area, and perhaps retest the $0.279 resistance.
The Chaikin Money Flow showed that capital flow was directed firmly out of the market, a sign of strong selling pressure.
Conclusion
The $0.24-$0.25 area was a good area to buy some XLM at, however, risk has to be carefully managed as XLM has not shied away from dropping as low as $0.235. At the same time, the presence of a bullish divergence at an area where there has been a lot of liquidity in recent days could also see a bounce, but the risk-to-reward of such a move might not be justifiable for risk-averse traders.


