- Bitcoin (BTC) experienced a slight gain in the last 24 hours.
- Trading volume for BTC has also picked up in the last 24 hours.
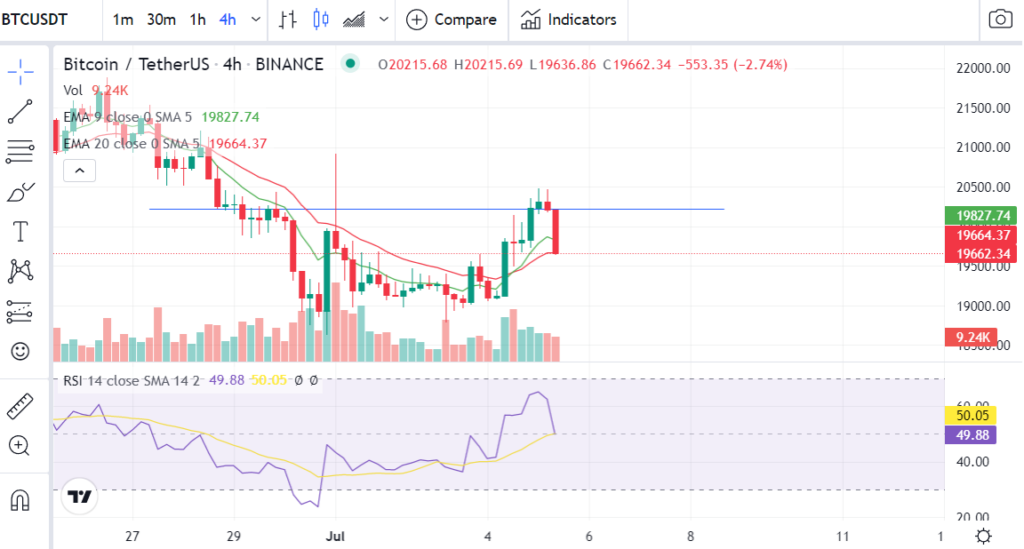
- BTC closes the 4-hour candle below the 20 EMA line and could see its current brief bull cycle come to an end.
The crypto market leader Bitcoin (BTC) experienced a slight gain in the last 24 hours according to CoinMarketCap. As a result, BTC still finds itself below $20k.
In the last day, BTC’s price has risen 2.69% – taking its market cap up to $37.67 billion. Despite the 24-hour rise in BTC’s price, it is still down 6.36% over the last 7 days.
Trading volume for BTC has also surged in the last 24 hours as the figure stands at $25,241,943,043, which is just over a 62% increase in activity.
When looking at the 4-hour chart, BTC’s price was unable to hold up above the $20k level. This resulted in its price plummeting down to its current level in the last 4 hours.
BTC’s price movement is also reciprocated in the Relative Strength Index (RSI) indicator as it dived from overbought territory to the current level of the RSI SMA. If the RSI crosses below the RSI SMA line, BTC will signal a bearish flag. This could be followed by a further downwards spiral for its price.
More so, If this fall happens, then BTC could drop to as low as $18,500-$19,000, which is the next significant support level. However, this bearish thesis will be invalidated if the 4-hour candle is able to close above the 9 Exponential Moving Average (EMA) line.
To justify a potential bullish recovery, the 20 EMA is positioned below the 9 EMA line. This indicates that BTC is in a brief bull cycle. If BTC closes the candle below the 20 EMA, the cycle may come to an end.
Disclaimer: The views and opinions expressed in this article are solely the author’s and do not necessarily reflect the views of CQ. No information in this article should be interpreted as investment advice. CQ encourages all users to do their own research before investing in cryptocurrencies.


