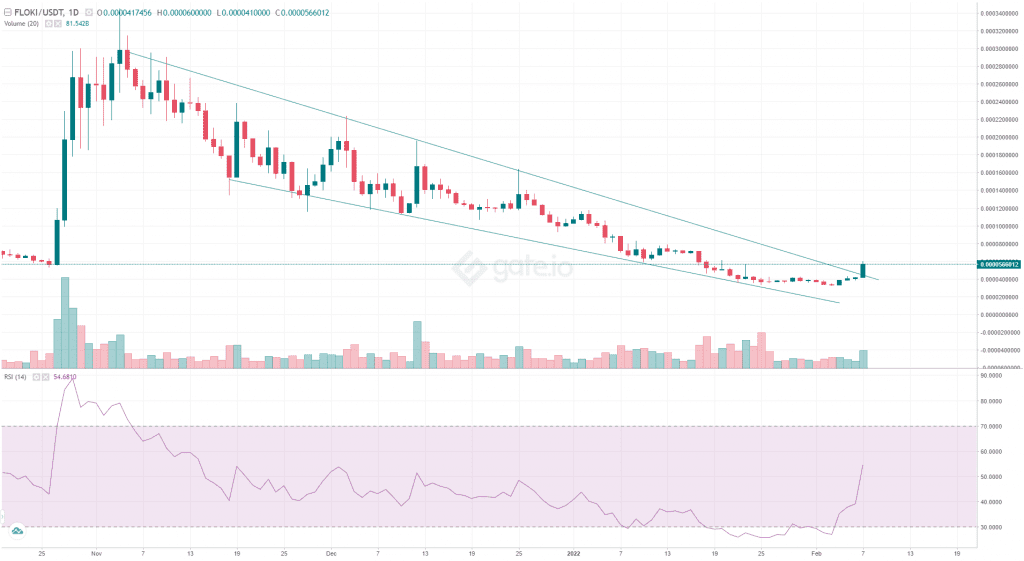
While the overall trend for FLOKI/USD pair is bearish as the sellers were leading this downtrend through a falling wedge pattern. However, on February 7th, a massive bullish candle with 36% intraday gain pierced through the long coming descending trendline, indicating the first sign for a bullish reversal.
Key technical points
- Floki Inu buyers reclaim the 20-day MA
- The intraday trading volume in the Floki Inu token is $12.9 Million, indicating a 151% gain.
Source- Tradingview
In our recent coverage of Floki Inu technical analysis, Coingape summarized the short-term downtrend, which tumbled the coin prices by 87% and plunged to a new lower low at $0.00001624.
During the downfall, the coin price was resonating in a falling wedge pattern, whose descending trend helped bears to sell on rallies. However, today the FLOKI buyers showed a sudden spike in demand, which poked the shared dynamic resistance of the pattern’s trendline and 20-day MA.
The Relative strength index(55) slope shows a sudden pump above the equilibrium, suggesting the bears are losing their grip.
The buyers have flipped the 20-day resistance into possible support. However, the downsloping 50 and 100 indicates a bearish trend.
FLOKI/USD: 4-hour Time Frame Chart

Source- Tradingview
In the last five trading days, the FLOKI price has pierced through three resistance of $0.0000387, $0.000047, and $0.000056, indicating a 75% from February 4th low.
If buyers could sustain the recently breached $0.000056 mark, FLOKI price is likely to rally toward the immediate resistance of $0.000065.
Conversely, a minor pullback is expected to the $0.0000475 support to stabilize the ongoing rally.
- Resistance levels- $0.000065 and $0.000077
- Support levels-$0.000047 mark and $0.000038


