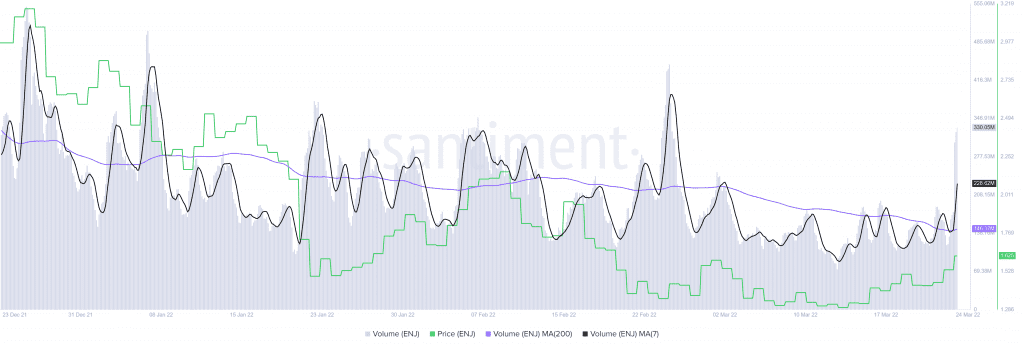
Enjin Coin price has seen three green days with a nice run-up. This move comes after ENJ bulls breached a declining trend line that subdued it since 25 November. The recent uptick in bullish momentum suggests that ENJ is leading the Metaverse coins like MANA or SAND.
Metrics forecast more gains
Enjin Coin price crashed roughly 75% in less than three months and bottomed around $1.20. The resurgence of buyers indicates that an uptrend is likely to continue. Moreover, on-chain metrics seem to agree with the outlook and predict a bullish future for Enjin Coin.
The uptick in on-chain volume from 118 million to 330 million suggests that whales are interested in ENJ at the current price levels. This development could also attract FOMOing retail investors who could keep the uptrend going.
Additionally, the volume seems to be on the rise since 13 March and has not shown any signs of heading lower. Thus, serving as a tailwind to the Metaverse token.
Adding credence to this move is the recent uptick in whale transactions for Enjin Coin. These transactions are worth $100,000 or more and are often footprints of high networth investors. Tracking these transfers help market participants get a grasp of what these institutional investors could be on. Essentially, this on-chain index serves as a proxy for such investors.
A spike in this metric could be seen as bullish if it occurs at the bottom of the bear run and bearish at the top of a bull run. Considering how ENJ has lost 75% of its value, the recent increase in transactions worth $100,000 or more from 6 to 40, reveals an optimistic outlook for Enjin Coin.
While things are looking up for ENJ, market participants need to exercise caution as a pullback may be around the corner. Moreover, the uncertainty around Bitcoin could lead to a sub-optimal outlook for Enjin Coin.
Perhaps the most interesting metric is the supply of ENJ held on exchanges. This index can be used to determine the potential sell-side pressure for an asset. For Enjin Coin, the holdings of ENJ have increased from 403 million to 417 million.
This net 14 million uptick in ENJ entering centralized exchange wallets indicates that these investors might sell in case of a flash crash, compounding the sell-side pressure and causing more losses. Therefore, market participants need to exercise caution when investing in Enjin Coin.


