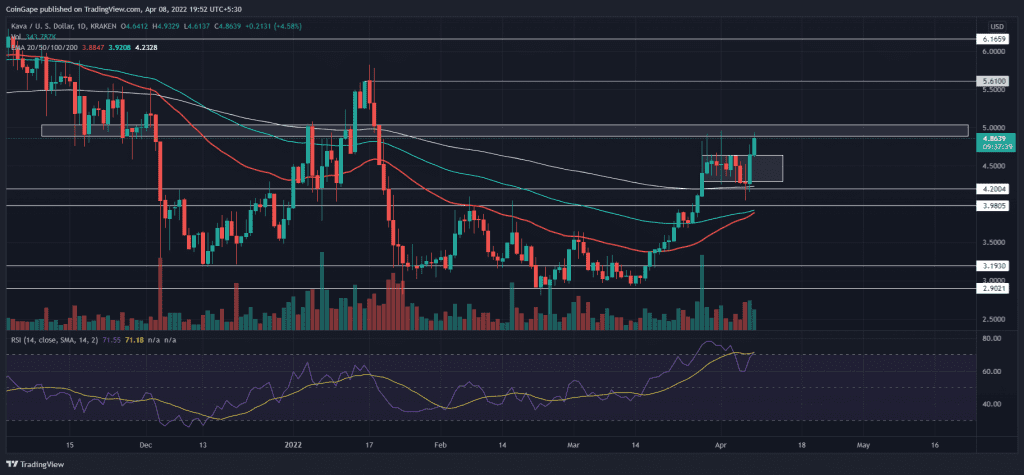
The uptrend continues with the 200-day EMA retest, and the KAVA coin price challenges the $5 resistance zone. With the inevitable crossover of the 50 and 100-day EMAs, the possibility of uptrend continuation above $5 increases. But should you be bullish when BTC is below $45K and clings to the 50-day EMA?
Key points
- The short consolidation rally challenges the $5 resistance zone.
- The 50 and 100-day EMA are ready for a bullish crossover.
- The intraday trading volume in the Kava coin is $164.56 Million, indicating a 2.09% rise.
Source-Tradingview
On 16th March, the KAVA coin price experienced a significant inflow resulting in a rally surpassing the $4 mark and a double bottom breakout. The breakout rally outperformed the 200-day EMA but faced a colossal supply availability at the $4.88 level.
The KAVA coin price action created a short consolidation with a rise in bearish influence on 4th April, resulting in a retracement to the 200-day EMA. However, buyers stepped in at the trend-defining EMA and pushed the prices above the consolidation range.
The bullish breakout reaching the $4.85 level undermines the previously seen higher price rejection and increases the chances of the $5 breakout. Hence, the breakout will illuminate a buying opportunity with the possibility of a 15% rise to the $5.6 mark.
Contrary to the bullish thesis, if sellers overtake the trend control at the $4.85 level, closing below the $4.6 mark will void the uptrend dogma and toy a retracement to $4.
Technical indicator
The uptrend continuation influences positive retracement in the EMAs, resulting in the 50 and 100-day EMA crossover.
The daily-RSI slope shows a V-shaped reversal to reenter the overbought territory and retest the 14-day SMA.
- Resistance level- $4.85-$5 and $5.6
- Support levels- $4.60 and $4


