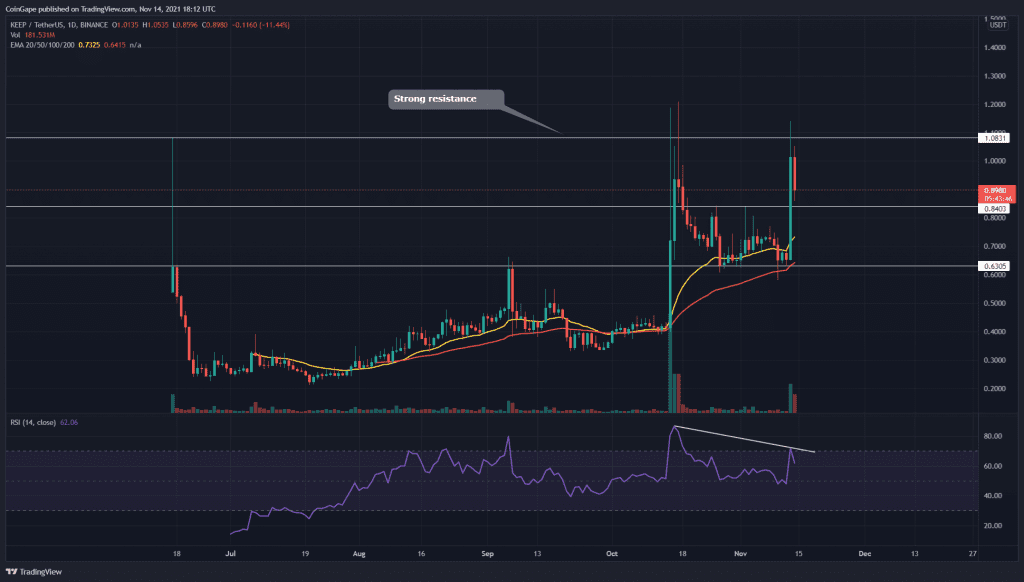
The technical outlook for the KEEP token states an overall uptrend, where the price presented an impressive recovery from its minor retracement phase. On November 13th, the token price provided a 50% gain in the intraday session, with a massive boost in trading volume. Will this rally continue?
Key technical points:
- The KEEP token shows a bearish divergence in its daily-RSI chart
- The KEEP chart forming a Cup and Handle Pattern in the 4-hour time frame chart
- The intraday trading volume in the KEEP token is $1 Billion, indicating a 1680.2% hike
Source- KEEP/USD chart by Tradingview
On October 18th, the KEEP token was rejected from the All-Time High resistance of the $1.08 mark, initiating a minor retracement in this token. The token price plunged to $0.63 and wavering at this level to obtain proper support from it.
Furthermore, the token finally managed to bounce back from this support, displaying a massive green candle of 50% gain in its technical chart, supported by a huge boost in the volume activity. Today the token price faced decent selling pressure from this overhead resistance level, trying to push it to the lower levels.
The Relative Strength Index value is at 61 indicates a bullish sentiment within this token. However, the RSI line showed a bearish divergence in its chart, projecting weakness in this bull rally.
KEEP/USD Chart In The 4-hour Time Frame

Source- KEEP/USD chart by Tradingview
The KEEP token’s technical chart presents a Cup and handle pattern in the 4-hour time frame chart. This pattern could provide an excellent long entry opportunity if the price gives a decisive breakout from the $1.08 neckline.
Furthermore, the traditional pivot levels suggest that the trend’s following resistance level is $0.95, followed by $1.05. And, on the opposite end, the support levels are at $0.84 and $0.74.


