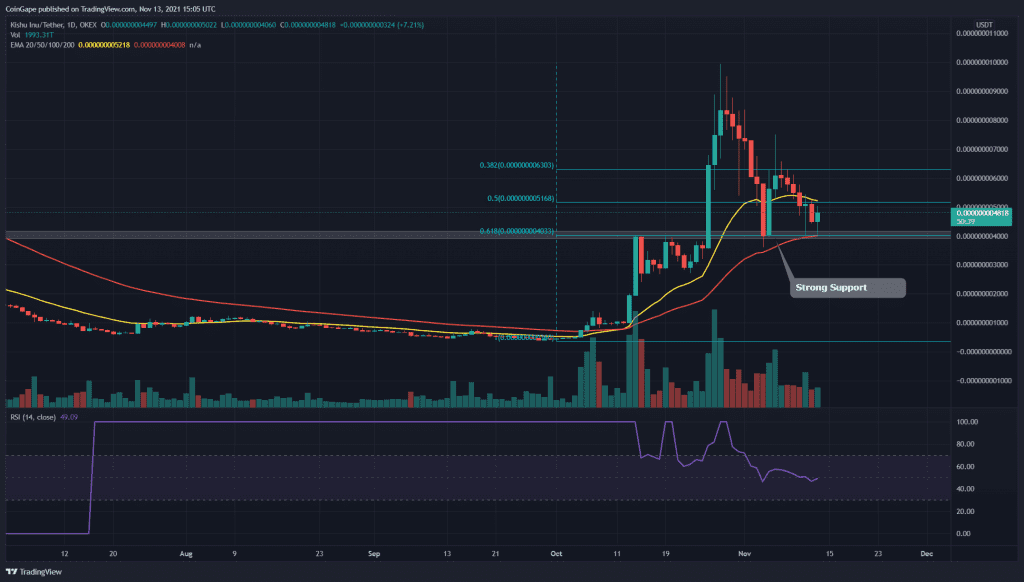
From a technical perspective, the overall trend of KISHU/USD is still bullish as the token is trying hard to sustain above the 0.5 Fibonacci retracement level. The token chart indicates a tug-of-war between the bulls and bears at this crucial support, the crypto should wait for its results to get an trading opportunty.
Key technical points:
- The KISHU chart shows a highly reliable descending trendline
- The daily chart RSI shows a striking drop in its value
- The intraday trading volume in the KISHU token is $22.6 Million, indicating an 18.3% fall.
Source- KISHU/USD chart by Tradingview
On October 26th, the KISHU token provided an excellent opportunity for the crypto traders when the price gave a breakout from a Cup and Handle pattern. This new rally made a high of $0.00000001 before it retraced back to the retest the $0.000000004 neckline of the bullish pattern.
The token price tried to bounce from this support on November 5th, but it couldn’t rally much higher and plunged back to this support level. Furthermore, the 50 EMA line also igve its contribution to this support region.
As for the Relative Strength Index (49) is has shown a significant drop for the token’s retracement phase, indicating some weakness for KISHU price.
KISHU/USD Chart In The 4-hour Time Frame

Source- KISHU/USD chart by Tradingview
The KISHU token chart shows a highly reliable descending trendline that has been leading this short-term downtrend in its price. This trendline has provided multiple resistance to the token and would act as an excellent confirmation if the price decides to rally higher.
However, the KISHU price is currently in a make-or-break situation, as it is resonating between crucial support and dynamic resistance. Therefore, the crypto traders should be patient and till the price breaks out from either of these levels before initiating a new position in this token.


