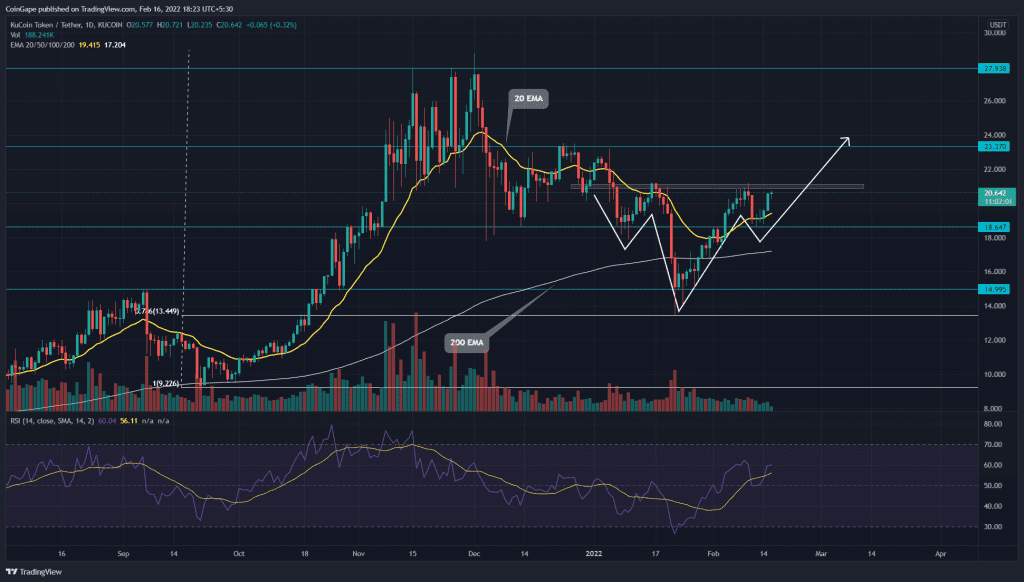
The V-shaped recovery in KCS price registered 56% gain in less than a month. Moreover, the technical chart revealed an inverted head and shoulder pattern, which heightens the possibility of trend reversal. A bullish breakout from the $23.3 neckline would complete the chart pattern, providing an long opportunity for crypto traders.
Source-Tradingview
The Past Performance Or Trend
The correction phase initiated in December 2021 tumbled the KCS/USDT pair by 53% and brought it to 0.786 Fibonacci retracement level($13.5). The buyers aggressively defended this level and amid the recent recovery in the crypto market, the KCS price surged 56% to the $21.2 mark.
A few higher price rejection candles at the overhead resistance, indicated profit booking from long traders. A minor pullback(11.5%) to the $18.6 mark immediately rebounded, suggesting the sentiment has switched and traders are buying on dips.
Moving Average(20-100) bullish crossover Bolster the ongoing rally
The KCS/USDT technical chart displays an inverted H&S pattern in the daily time frame chart. This bullish reversal pattern has its neckline at the $21.2 mark and the buyers are on the verge of crossing above this overhead resistance.
If they succeed, the KCS price will complete the bullish pattern, providing an immediate target at $23.3. Furthermore, a bullish breakout from this following resistance could intensify buying pressure and surge the altcoin to the All-Time High resistance of $28.
By the press time, the current price of the KCS coin is trading at $20.6, with an intraday gain of 0.58%. Moreover, the 24hr volume change is $11.2 Million, indicating a 1.48% loss. According to coinmarketcap, the coin stands at #62 rank with its current market cap of $1.65 Billion(+1.44%).
Technical indicator
The recent price jump recovered the bullish alignment of the crucial EMAs(20, 50, 100, and 200). Moreover, a bullish crossover of the 20-and-100 EMA, attracts more buyers to the market.
The Relative Strength index(60) slope rallying higher in the positive territory accentuates the bullish momentum.
- Resistance levels- $21.2 and $23.3
Support levels- $18.6, 200-day EMA


