Chainlink [LINK] revealed its latest adoption update that the chain managed to achieve more than 15 integrations with top blockchains in the last seven days. This update could strengthen LINK’s long-term bullish outlook, but is it enough to help secure the recent short-term gains?
Here’s AMBCrypto’s price prediction for ChainLink (LINK) for 2022-2023
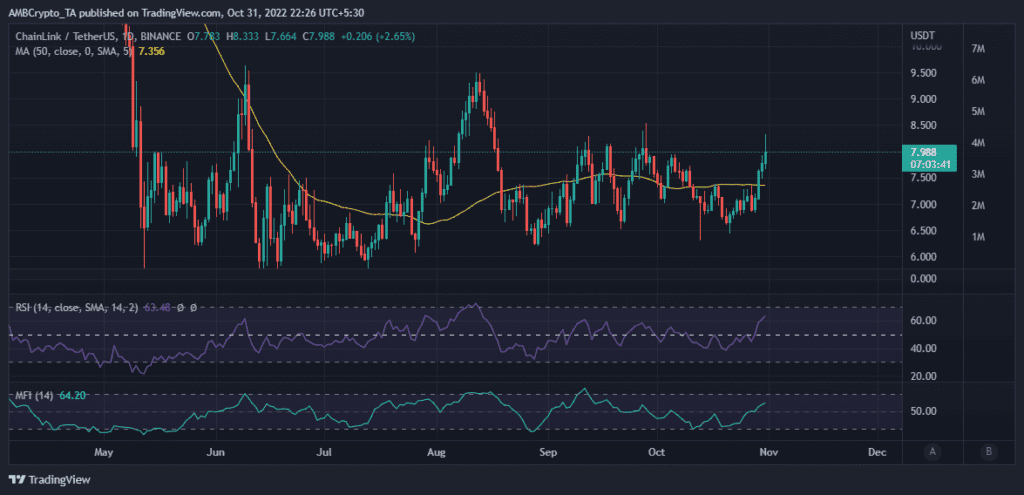
LINK experienced an explosion of bullish demand since 21 October after almost retracing to its current monthly lows. The subsequent upside surprisingly allowed LINK to surpass its previous monthly high, before peaking at $8.33 as of 31 October. This means that LINK managed to bounce by almost 30%.
However, LINK’s $7.97 price of 31 October reflected a slight pullback from the current monthly high. This could indicate that LINK might not be free of its current lower range.
The pullback was an important observation with October’s end. The attention was now on whether LINK will extend its upside in November or give up some of the recent gains. Note that the recent peak yielded downward pressure above the $8 price level. This confirmed resistance and increase in sell pressure. Furthermore, this underscored the chances of sizable retracement if LINK bulls were unable to defend recent gains.
The other side of the coin
LINK was not oversold despite its recent upside, hence, there was still a significant probability that the upside may extend a while longer. Enough demand might boost the bulls, allowing them to overcome the current short-term resistance level. Such an outcome may trigger a retest of the $8.5 or $9.2 resistance levels.
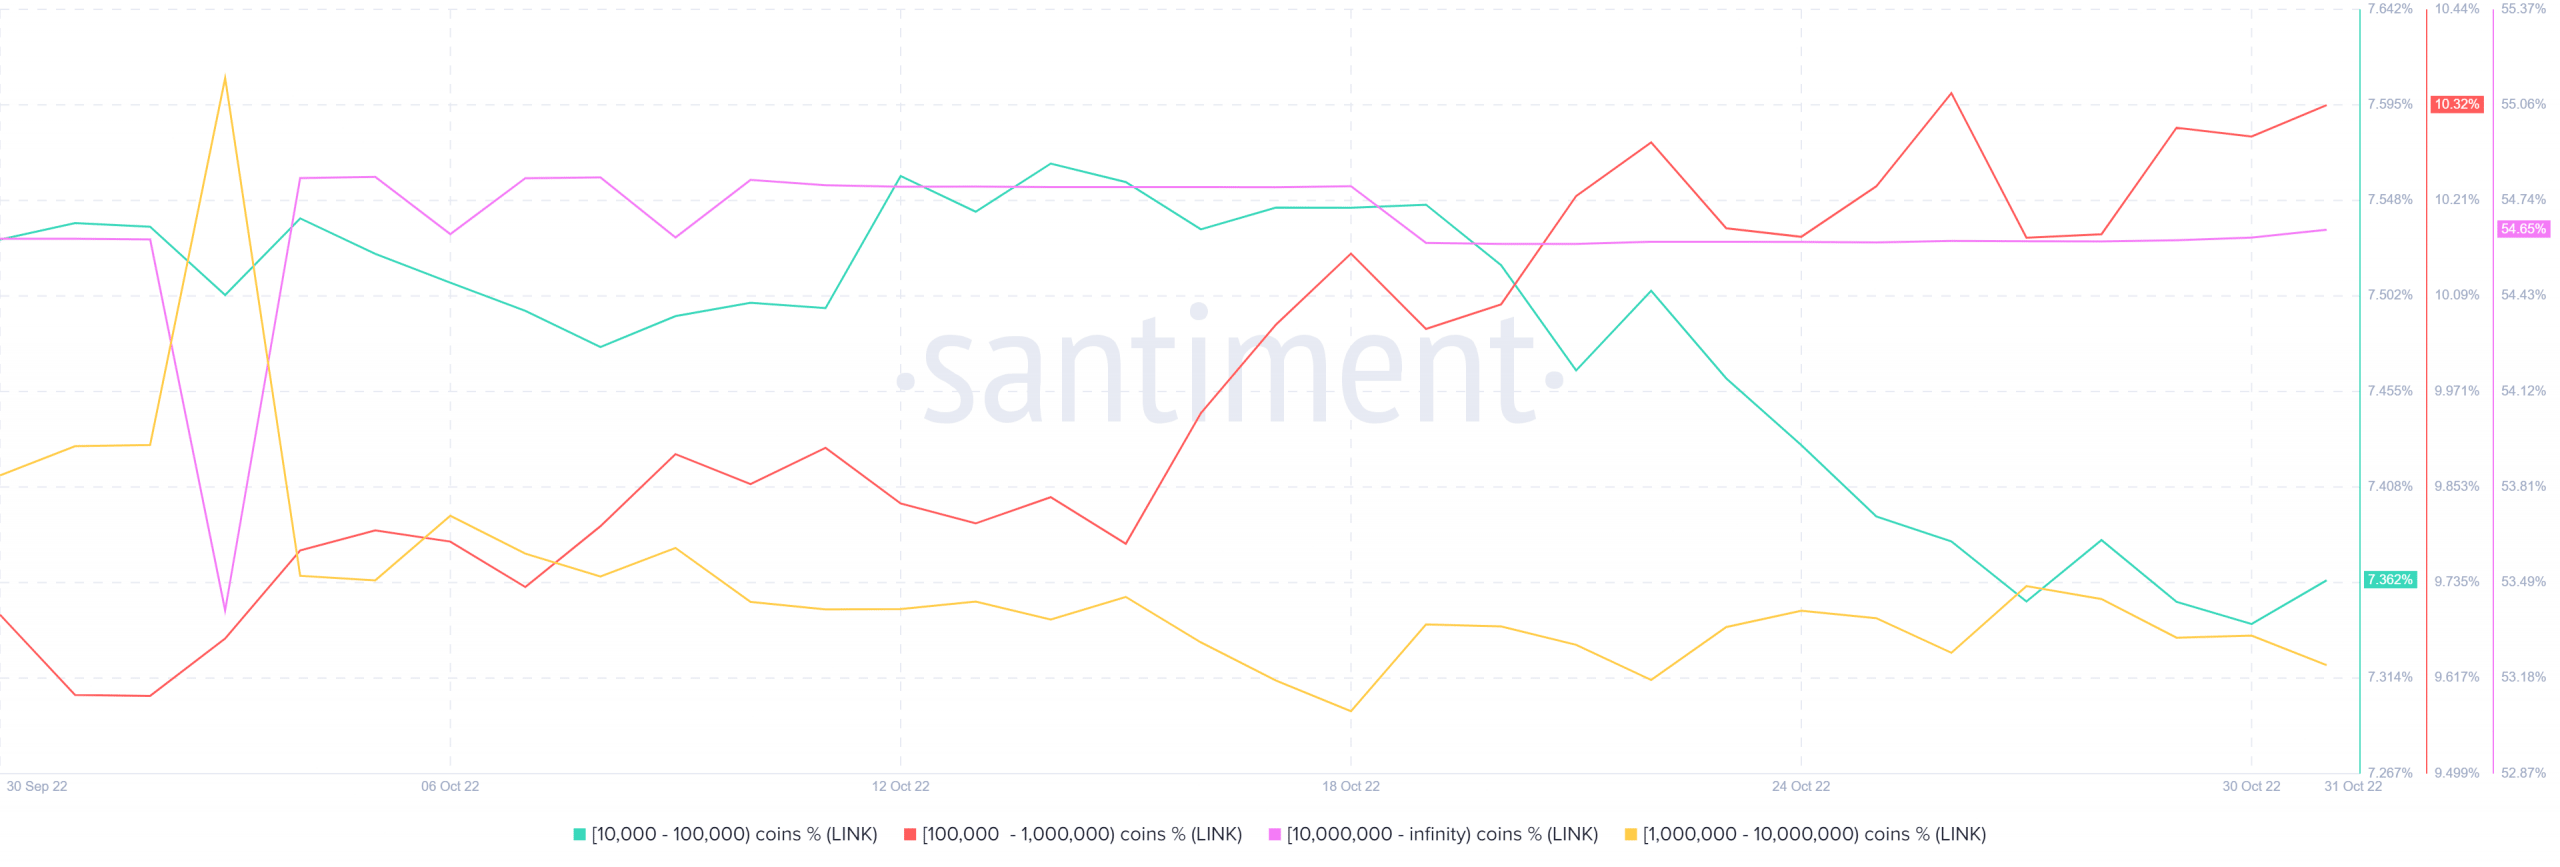
Can LINK sustain enough demand for the bulls to remain in control? Its supply distribution by balance of addresses revealed that the largest whale category (addresses holding over 10 million LINK) increased their balances slightly. Smaller whales holding between 10,000 and 1 million coins also added to their balances between 30 and 31 October.
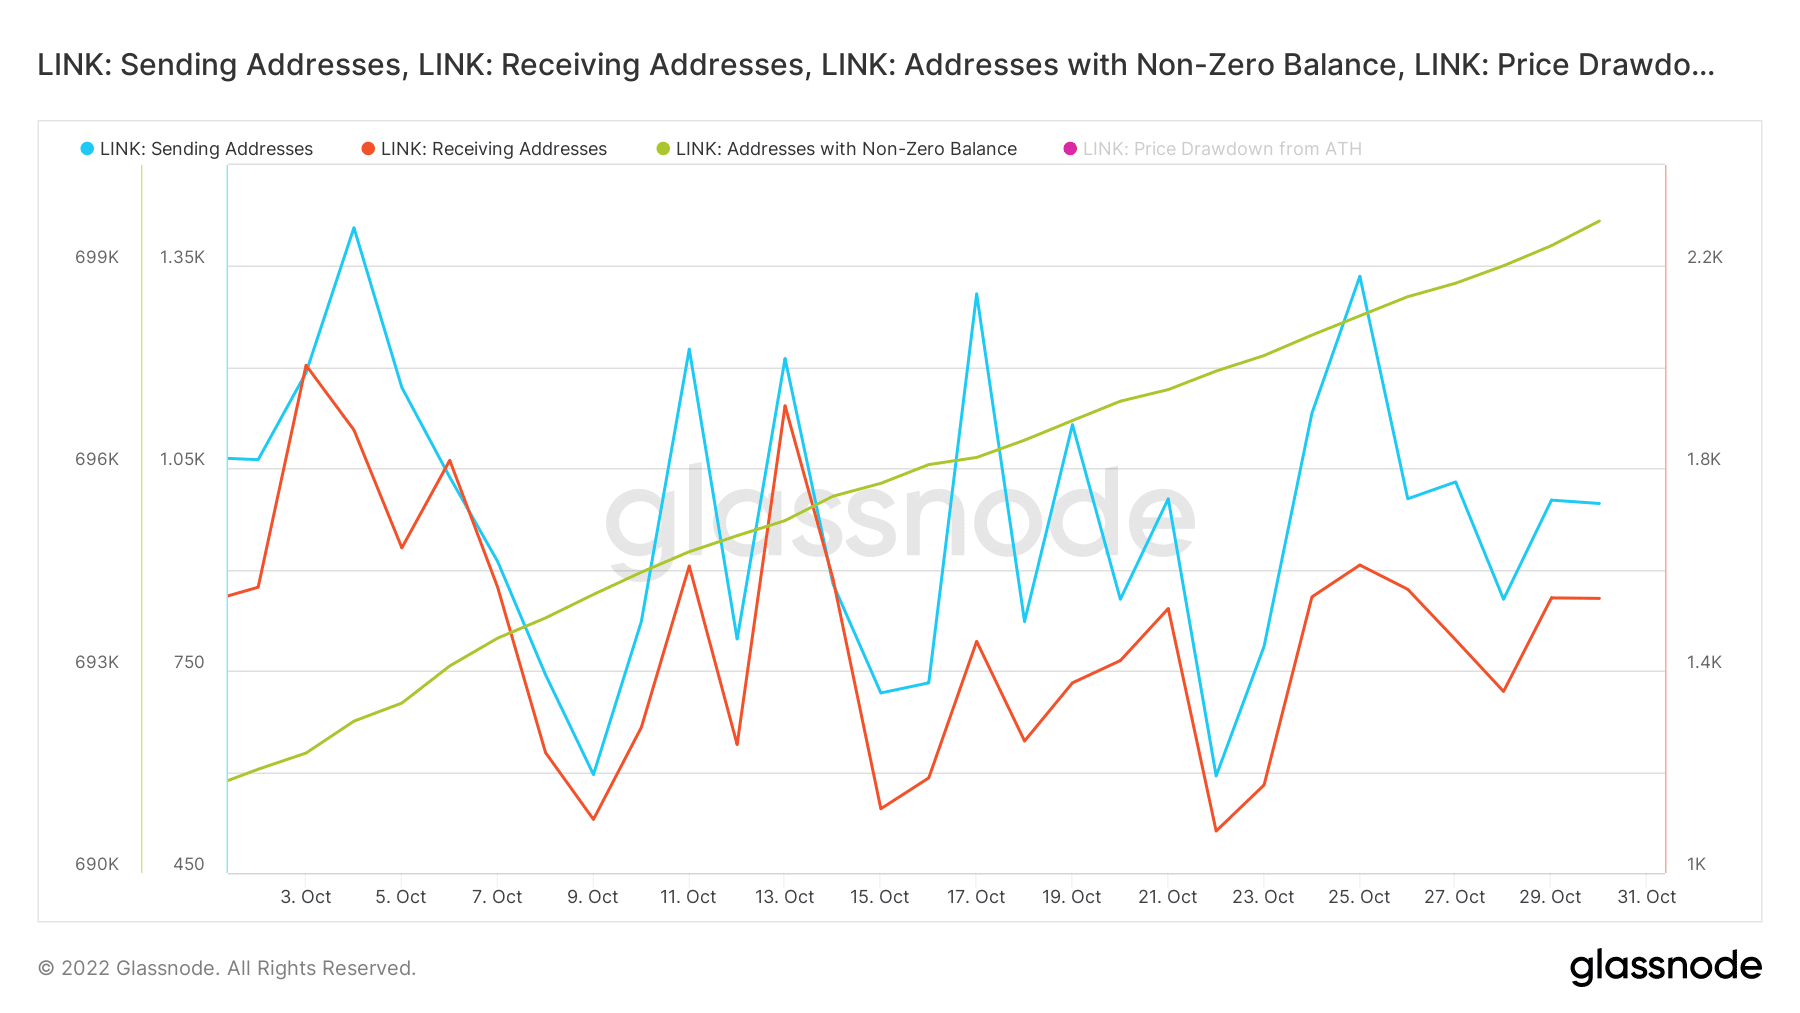
Most of the sell pressure in the last 24 hours also came from addresses holding between 1 million and 10 million LINK. A look at address flows revealed that receiving addresses were still higher than sending addresses. This confirmed that there was still a higher net demand compared to the prevailing sell pressure at the time.
The number of addresses holding LINK continued to grow steadily in October, setting a favorable precedent for November.
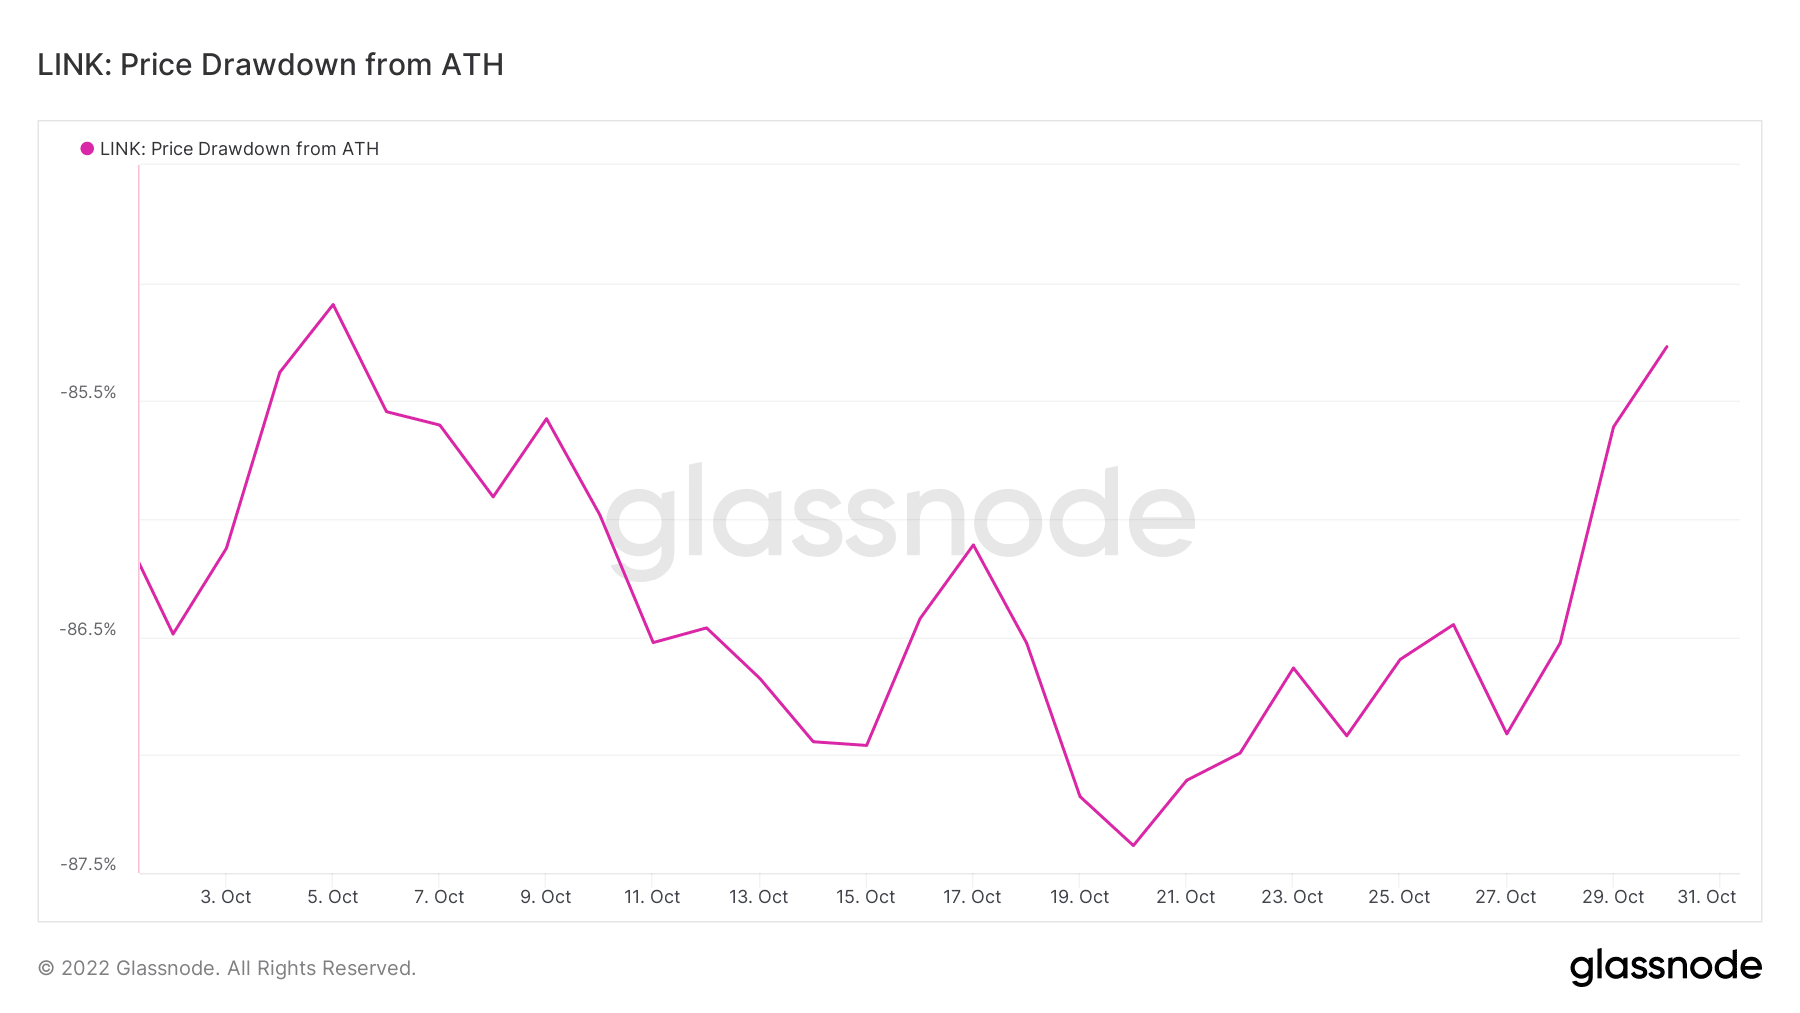
LINK’s latest performance contributed heavily to its recovery from its current 2022 lows. Nevertheless, it was still trading at a large discount compared to its historic highs.
LINK still has a long way to go before regaining its ATH. From the above analysis, the current demand levels still favor the upside. However, investors should still exercise caution considering the current short-term support and the potential economic headwinds that might disrupt the current trajectory.


