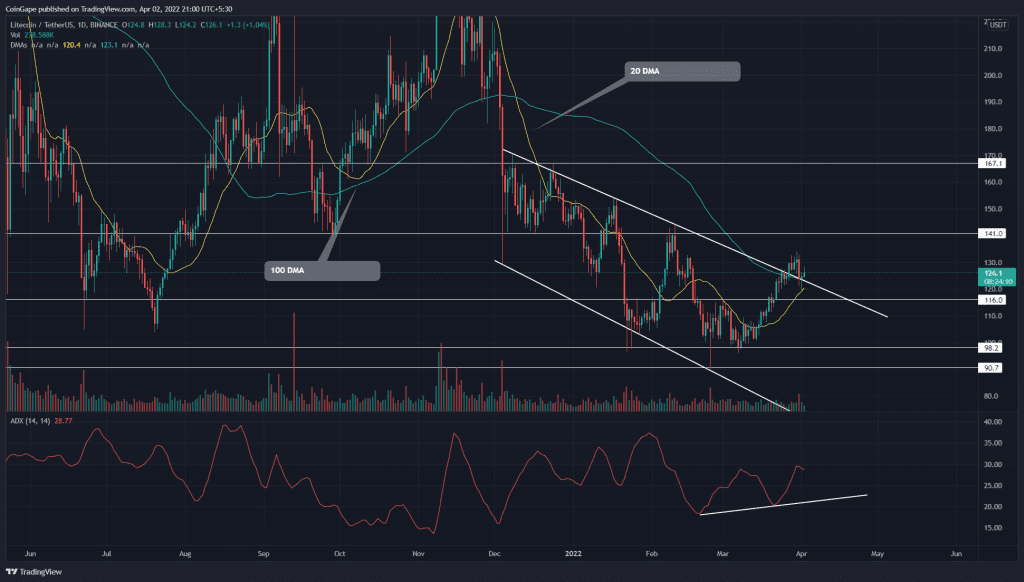
On March 27th, the Litecoin(LTC) price gave a massive breakout from the falling channel pattern. The coin price is currently stuck in a retest phase and trying to sustain above the breached resistance. Can this pattern completion revert the prior downtrend sentiment?
Key points
- The LTC Price shows a daily-morning star candle pattern at 100 DMA
- The 20 and 100 DMA are nearing a bullish crossover
- The intraday trading volume in the Litecoin coin is $739.1 Million, indicating a 27.1% loss.
Source- Tradingview
After tumbling to a low of the $90 mark in late February, the LTC/USDT pair initiated the next bull cycle inside the falling expanding channel pattern. The bullish rally drove the altcoin by 49%, with a bullish breakout from the channel pattern.
The Litcoin price entered retest mode after making a high of $134.2 mark and reverted by 7.32%. Furthermore, the formation of the morning star candle at the breached resistance and 100-DMA suggests the market sentiment has switched from selling on rallies to buying on dips.
The buyers need to sustain above the 100 DMA($122) level to yield a potential 30% growth till the $167 mark.
On the contrary note, if sellers pressurized the altcoin for a candle closing below the descending trendline, the LTC price would enter the channel pattern, and the resulting fakeout could slump the coin to $100.
Technical indicator
The bullish rally surged above the 20, 50, and 100 DMA resistance line. Furthermore, the lower price rejection candle at 20 and 100 DMA lines suggest this prior resistance is flipped into valid support.
The rising Average Directional Index(ADX) indicator slope highlights a significant gain of upside momentum.
- Resistance level- $141 and $153
- Support levels- $116, and $100-$98


