Published 21 mins ago
Over the past three weeks, the LTC price has resonated within the falling channel pattern. The recent bulls cycle bolsters buyers to rechallenge the resistance trendline. A potential breakout could trigger a genuine recovery rally. should you be entering a long trade?
advertisement
Key points:
- LTC prices have increased by 1.29% in the last 24 hours.
- The price action shows a highly bearish resistance trendline.
- The intraday trading volume in the Litecoin coin is $345.6 Million, indicating a 28.3% loss.
Source- Tradingview
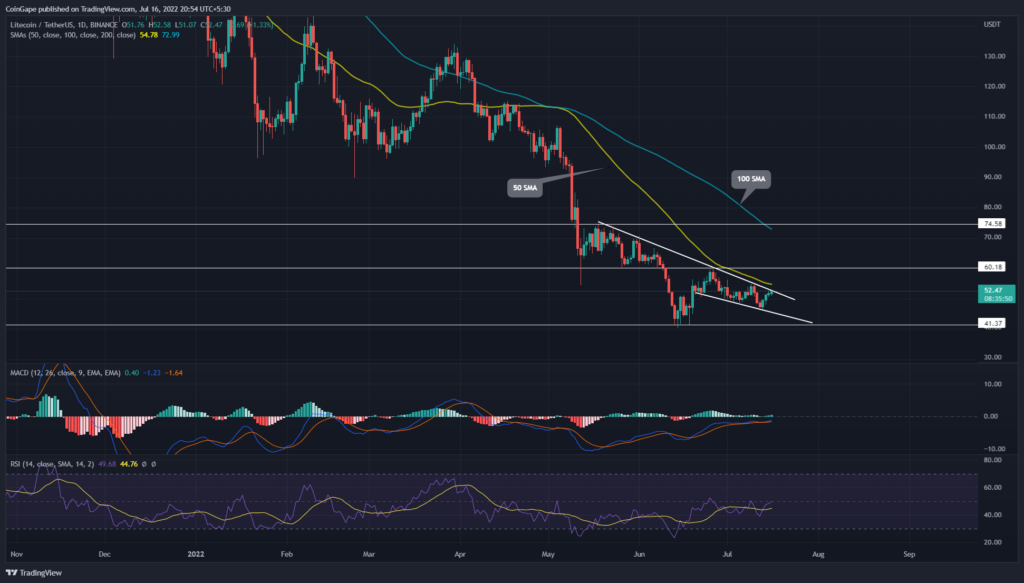
The LTC price action shows a long-coming downtrend under the influence of a resistance trendline in the daily chart. The trendline nullifies the V-shaped bullish reversal from the $40 mark, accounting for a price jump of 50% in June 2022.
However, the increased selling near the trendline results in a falling channel formation, as a descending support trendline forms. The LTC price chart shows a bull cycle within the falling channel, challenging the resistance trendline and hoping for a bullish breakout.
Trending Stories
Moreover, the price action teases triple white soldier pattern formation as the streak of three bullish candles completes. If the LTC prices exceed the bearish trendline, the breakout rally might reach the $60 mark if the prices exceed the 50-day SMA.
On the opposite end, a bearish breakout will trend lower within the chancel to reach the $40 mark.
In a nutshell, LTC technical analysis displays a potential breakout rally exceeding the 50-day SMA to reach the $60 mark.
Technical indicator
The supertrend indicator highlights an overall downtrend.
The MACD indicator shows the fast and slow lines avoiding multiple bearish crossovers to maintain an uptrend and reach the zero line.
The RSI indicator shows a sharp reversal in the nearly oversold zone and suppressed the 14-day SMA reflecting an increase in the underlying bullishness.
advertisement
Hence the momentum indicators reflect an increase in buying pressure and project a potential bullish breakout.
- Resistance Levels: $60 and $7
- Support Levels: $45 and $40
Share this article on:
The presented content may include the personal opinion of the author and is subject to market condition. Do your market research before investing in cryptocurrencies. The author or the publication does not hold any responsibility for your personal financial loss.


