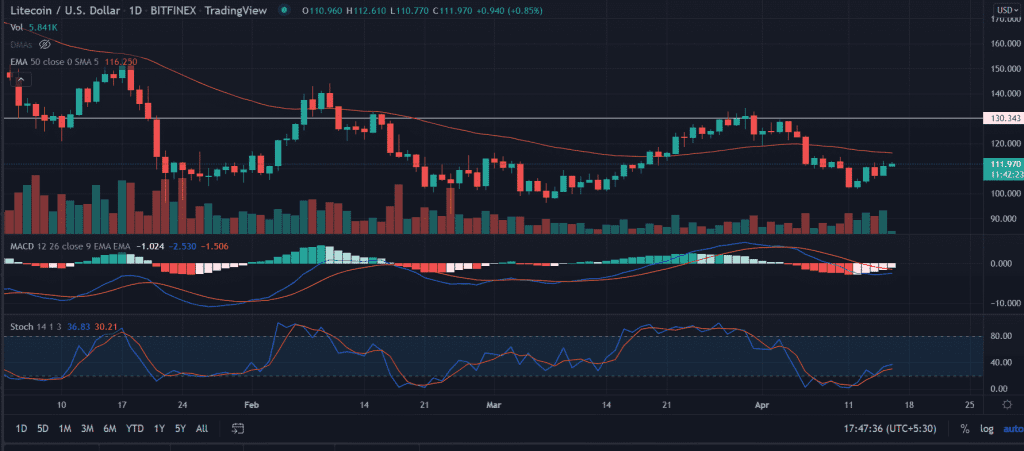
LTC price trades with significant gains from where an upswing is possible as per the technical setup. The prices rise from a vital support level that indicates that a short-term uptrend seems likely in the coming days for the asset.
- LTC price extends the gains for the second session in a row.
- Looking for an ascent of 16% after forming the double bottom near $100.0.
- However, immediate upside resistance is placed near the 50-day EMA.
LTC price looks for gains
LTC price rallied 36% from $8 from the lows to set the swing highs at $1.23. The upsurge in the price is expected to continue as supported by the above-average volumes.
After tagging the recent highs the price retraced a multi-week support level. Since then LTC’s price has appreciated in the past five sessions.
On the daily chart, if the LTC buyers are able to move beyond the 50-day EMA at $116.55 it will strengthen the upside arguments in the price as it will mark the cross of a significant upside barrier. The bulls will be tagging the April 6 highs at $123.24.
Furthermore, a daily close above the mentioned highs would attempt to take out the horizontal resistance line at $130.0.
Trending Stories
On the contrary, a move below the session’s low would invalidate the bullish outlook on the asset. On moving downside, the price could fall straight to the psychological $100.0 level. In addition, a daily close below the mentioned level would trigger another round of selling at the LTC price.
As of press time, LTC/USD trades at $112.20, up 1.02% for the day.
Technical indicators:
Stochastic oscillators: The momentum oscillator rises above the oversold zone with a positive bias.
MACD: The indicator is in the process to move above the midline supporting the bullish outlook.


