Published 7 seconds ago
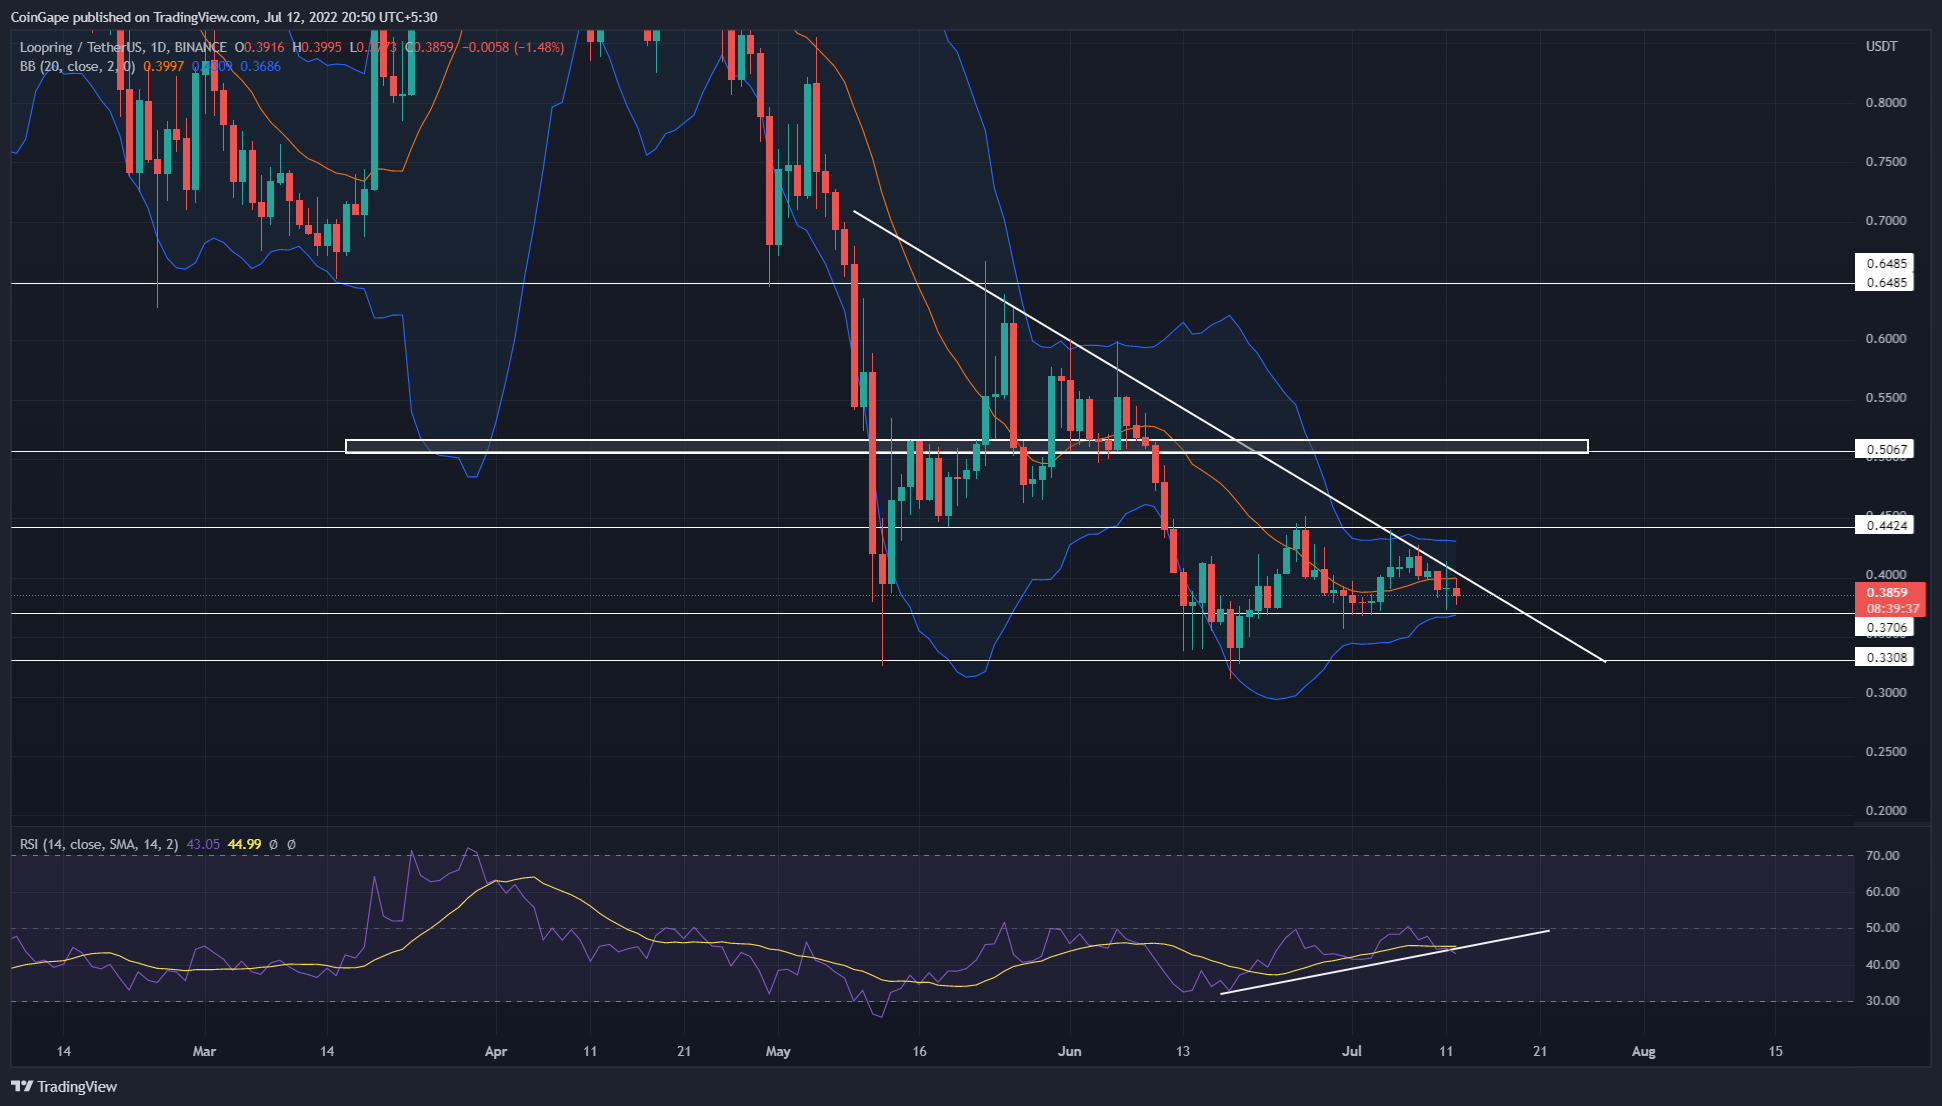
Over the past two months, the Loopring (LRC) price has wobbled in a descending triangle pattern. Moreover, the coin price has recently retested the falling trendline, which may trigger another bear cycle within this pattern. The expected downfall reached neckline support of $0.33. But what next?
advertisement
Key points:
- The LRC price has dropped 5% over the past five days.
- The daily-RSI slope shows an evident divergence concerning price action.
- The 24-hour trading volume in the Loopring coin is $143.5 Million, indicating a 189.6% gain.

Source-Trading view
Following the early-May sell-off, the LRC/USDT pair has been forming new higher lows under the influence of a descending triangle pattern. Furthermore, the neckline support for the pattern is located at $0.33, preventing a further downfall.
However, within this pattern, the LRC price has resonated between the two horizontal levels of $0.44 and $0.37 for the past three weeks. In addition, the altcoin wavering in this range has retested the descending trendline, replenishing the selling momentum.
Trending Stories
The sustained selling should breach range support of $0.37 and slump the altcoin 10.5% lower to the $0.33 neckline.
Moreover, this triangle pattern, in theory, reflects the losing bullish momentum, which should eventually breach the neckline support. Thus, a breakdown from the $0.33 support would indicate the resumption of the prevailing downtrend.
Having said that, the pattern still holds the possibility of a trendline breakout, which may overturn the bearish theory.
Technical Indicator
The super trend indicator highlights an overall downtrend in the daily chart.
However, the daily-RSI slope shows an inverse rally of falling price action, undermining the bearish pattern. This complete divergence supports the bullish breakout from the resistance trendline, which may surge the LRC price to the $0.648 mark.
advertisement
The Bollinger Band indicator has significantly narrowed its range, accentuating the short consolidation. This breakout from either of its levels may provide additional confirmation on the respective rally.
- Resistance levels- $0.44 and $0.5
- Support levels- $0.37 and $0.33
Share this article on:
The presented content may include the personal opinion of the author and is subject to market condition. Do your market research before investing in cryptocurrencies. The author or the publication does not hold any responsibility for your personal financial loss.


