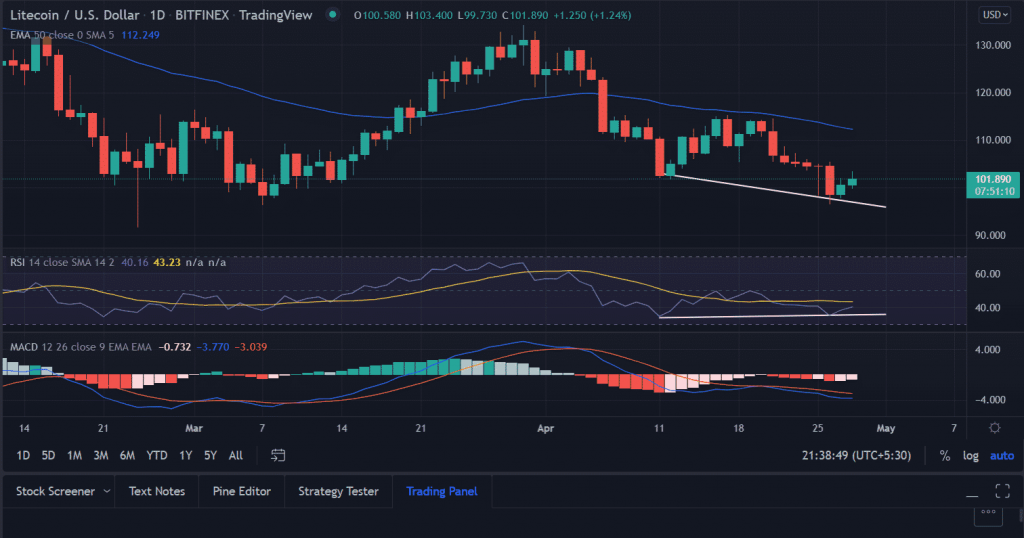
LTC price edges higher extending the previous session’s gains. The price trades in a very tight range with limited price action. LTC price is hovering near the support zone from where a bounce back in the price is expected from the technical point of view.
- LTC price gains for the second day in a row on Thursday.
- The double bottom formation on the daily chart suggests a bounce back in the price toward $115.0.
- However, the downside remains intact below $95.0.
LTC price looks for an upside reversal
On the daily chart, the LTC price surged nearly 39% from the lows of $96.27 to the swing highs of $134.09. However, the bulls failed to carry forward the gains and retreated. The formation of ‘spinning top’, followed by a big red candlestick. LTC continued to trade on the downside since March 30. The selling further intensified as the price slipped below the critical 50-day ema (Exponential Moving Average) at $119.35.
LTC price tested the lows of $101.74, the levels last seen in February. Thus, forming a double bottom formation. Currently, the price is oscillating near the mentioned level after testing the lows of $97.74.
Now, a daily close above $104.0 would set the background for the next leg-up. A sustained buying momentum could push the price toward the horizontal resistance line at $110.0. Next, if the price manages to cross the 50-day ema at $112.0 investors could test the psychological $115.0 level.
Trending Stories
On the contrary, a daily close below Tuesday’s low of $96.41 would invalidate the bullish outlook on the price. In that case, the price could test $78.0, the levels last seen in December.
As of publication time, LTC/USD trades at $102.16, up 1.51% for the day.
Technical indicators:
RSI: The relative strength index gives bullish divergence on the daily chart since April 11.
MACD: The moving average convergence divergence trades below the midline with a neutral bias.


