According to a report, an arrest warrant has been issued by a court in South Korea against the founder of Terraform Labs, Do Kwon, and five others. The report in question went on to say that the allegations against Do Kwon include violations of the country’s capital markets laws, among others.
South Korean authorities believe that Do Kwon and the others named in the arrest warrant are now residents in Singapore. On the contrary, a statement by the Singapore Police Force on 17 September claimed that Do Kwon is not in the country.
In a series of tweets put out by Do Kwon himself, the exec denied being “on the run.” In fact, he claimed that he is “in the process of defending” himself and others “in multiple jurisdictions.”
I am not “on the run” or anything similar – for any government agency that has shown interest to communicate, we are in full cooperation and we don’t have anything to hide
— Do Kwon 🌕 (@stablekwon) September 17, 2022
Needless to say, in light of the aforementioned updates, it will be interesting to check out how LUNA reacted on the price charts.
Arrested growth for LUNA
LUNA holders initiated a “pump and dump” rally recently, one that saw the price of LUNA surge by 260% just a week ago. On 11 September, the coin was trading for as high as $7.06 on the charts.
It logged a total 24-hour trading volume of $1.75 billion that day. According to CoinGecko, the price rally caused the asset’s market capitalization to log a 209% increment – From $321 million to $995 million over the same timeframe.
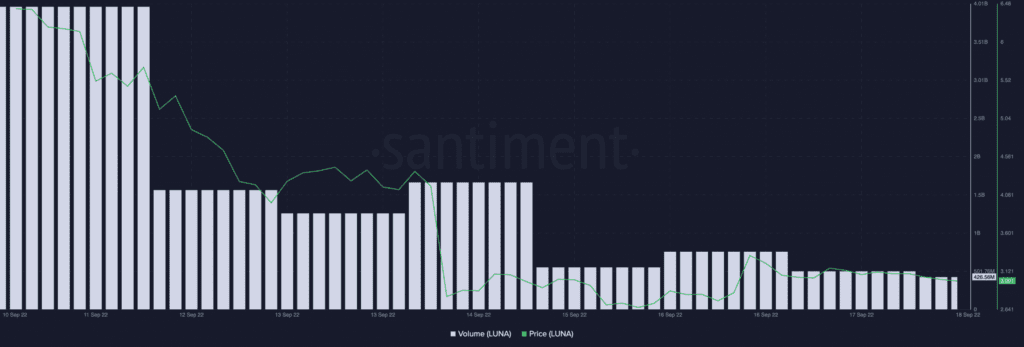
Losing most of its gains since the issuance of the arrest warrant, however, LUNA exchanged hands at $2.99 at press time. In fact, the crypto-asset’s price has gone down by 39% since 14 September.
While the price fell, the report of Do Kwon’s imminent arrest on 14 September led to a hike in LUNA’s trading volume. The price/trading volume divergence logged that day, however, hinted at coin distribution as investors who had acquired the asset during the 9-11 September rally scampered for profits.
Since 14 September, the daily trading volume for the asset has dropped by over 55%. At press time, this stood at $426.56 million, according to Santiment.
What does the 24-hour chart say?
On the daily chart, the bulls appeared to have lost the fight to the bears in the LUNA market. Following the price surge between 9 and 11 September, the momentary bull run saw the Moving Average Convergence Divergence (MACD) recording green histogram bars. However, a new bear cycle was initiated on 16 September when selling pressure rallied. This was signified by a downward intersection of the MACD line with the trendline.
A look at the Exponential Moving Average (EMA) confirmed that the bears had the upper hand. At the time of writing, the 20 EMA (blue) was below the 50 EMA (yellow) line, showing that sellers controlled the market.
With LUNA’s Chaikin Money Flow (CMF) positioned at -0.11, significant coin accumulation is required to ignite the severely declined buying pressure.


