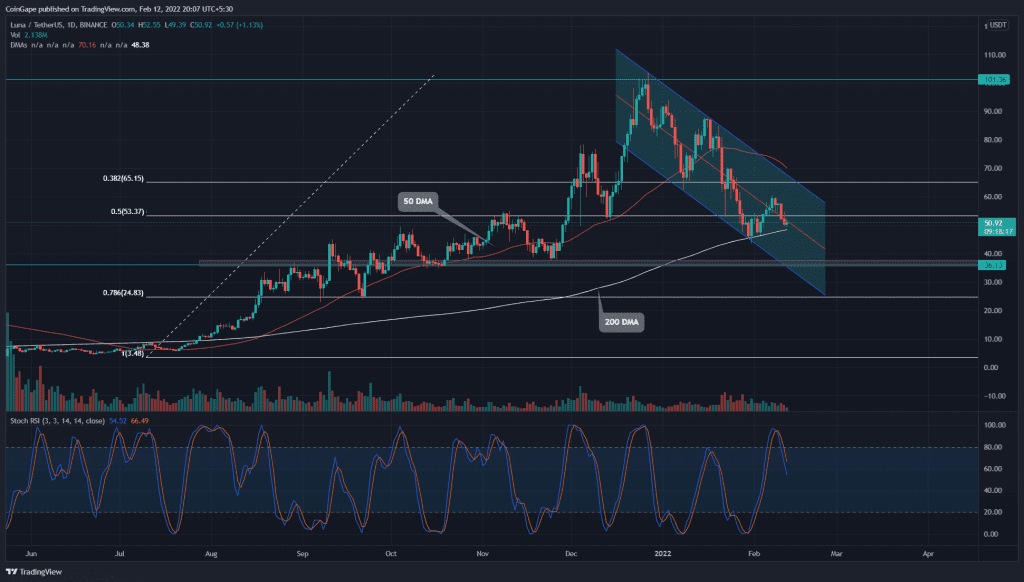
The LUNA price chart maintains the short-term downtrend wobbling in a parallel channel pattern. The first weeks of February led to a minor relief rally which reached the $60 psychological level. However, the sellers defending this mark have rejected the coin price and plunged to below the 0.5 FIB mark. How far will this correction go?
Key technical points:
- The 200 DMA stands as strong support for the LUNA price
- A rising ADX indicator signals a continuation of the downtrend
- The intraday trading volume in the LUNA is $1.5 Billion, indicating a 13.6% loss.
Source- Tradingview
On January 28th, the LUNA price pierced the 50% Fibonacci retracement level($53.6), threatening further downfall. However, the 200 DMA bolstered the bulls in defending this level and triggered a bullish reversal.
The relief rally registered a 39% gain from the January 31st low($43.3) and surged above the $53.6 mark. Yet, the buyers failed to push the altcoin much higher, and the price reversed from the $60 psychological level.
The daily-Stochastic RSI displays a bearish crossover of the K and D line, providing more confirmation for short-sellers.
LUNA/USD: 4-hr time frame chart

Source-Tradingview
The LUNA/USD technical chart indicates the pair is resonating a falling channel pattern. The buyer failed to sustain the coin price above the $53.6 mark, resulting in another fallout from the same level. The altcoin approaching the 200-day EMA level will test buyers’ commitment at this support.
If buyers rebound from the 200-day support, the LUNA price will climb to the downtrend line of the falling channel. On a contrary note, violating this bottom support, the sellers would sink the altcoin to $36 support.
The average directional movement index(19) curving up accentuates the rising bearish momentum.
- Resistance levels: $53, $65
- Support levels: 200-day, 36.8


