After nearing the absolute zero, the LUNA prices bounce back on what can be called an atomic scale. This is because the recovery hardly brings any consolation to the LUNA investors. But is it time for you to consider buying low, or is it just another trap for greedy bulls?
Key points:
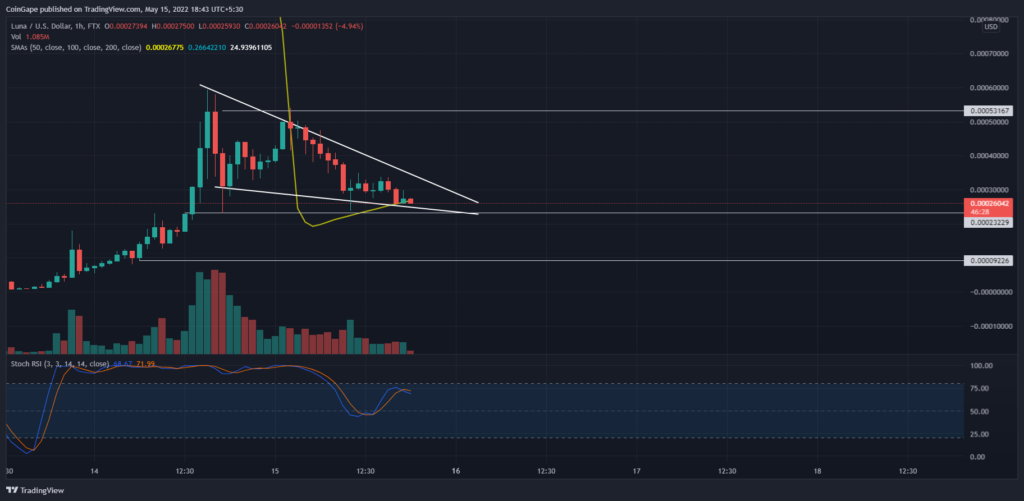
- The LUNA chart shows a falling wedge pattern.
- The intraday trading volume in the Terra is $4.92 Billion, indicating a 40% drop.
Source- LUNA/USD chart by Tradingview
Terra(LUNA) prices rose from the ashes yesterday, displaying a rise of more than 1000% in a day. Usually, this would be a piece of great news for investors but not for LUNA holders.
The price jump reaches the $0.00050 mark before diving deeper into the resistance trendline influence, resulting in a falling wedge pattern. The bearish pattern is formed due to the lower low formation and generally shows a bearish crackdown.
Trending Stories
And currently, resting at the support trendline close to $0.00002, the reversal chances are lowered. Moreover, the higher price rejection in the previous candle reflects bullish failure to reverse the trend.
The increasing selling pressure cracks the support trendline and warns of another fatal fall. Therefore, traders/investors finding a buying spot and hoping that LUNA regains its previous value or at least $1 must wait for the resistance trendline breakout.
However, under current situations, the resistance breakout seems improbable. Moreover, the trading volume in billions reflects high leveraged positions still in play.
Technical indicator-
The Stochastic RSI shows a bearish crossover in the neutral territory reflecting increased chances of the support trendline failing to sustain the selling pressure.
The 20-period SMA struggles to provide bullish support and control the selling pressure.
- Support level- $0.000020, and $0.00010
- Resistance level- $0.00040 and $0.00055


