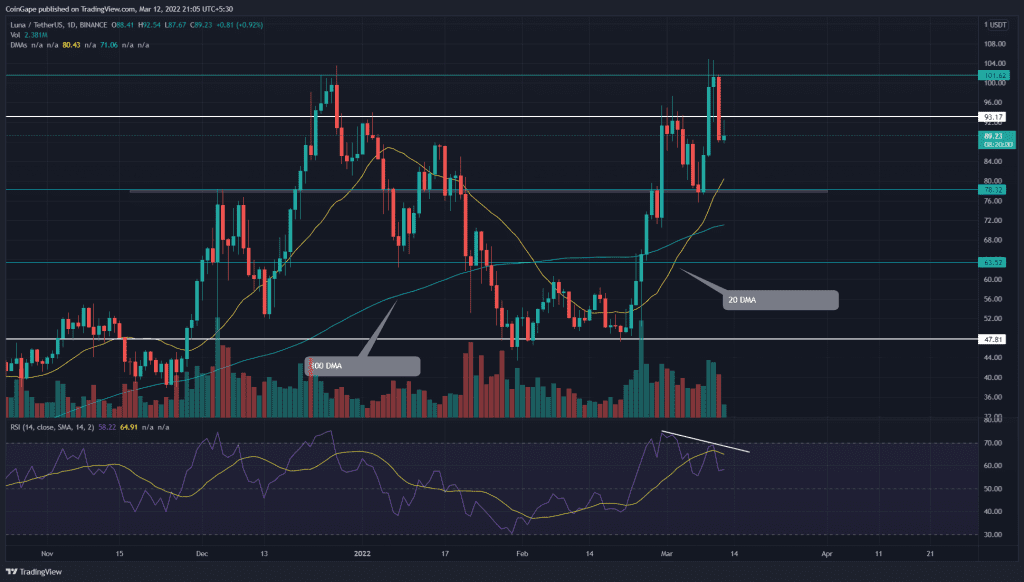
On Friday, the Terra (LUNA) price turned down from the $100 resistance forming an evening star candle pattern. The long-bearish candle showed a 13% intraday loss and breached the $93 support. Can the sellers extend the correction to $78.5 support, or will buyers step in to continue their rally?
Key points:
- The LUNA chart shows a higher price rejection candle at $93 flipped resistance
- The daily RSI chart shows negative divergence.
- The intraday trading volume in the LUNA is $3.386 Billion, indicating a 41% loss.
Source- Tradingview
Amid the geopolitical issue between Russia and Ukraine, the Terra coin gathered remarkable gains as February ended. The altcoin doubled from the $48 support in less than three weeks, resting the All-Time High resistance of $100.
However, the higher price rejection candle on march 9th and 10th suggested the sellers continue to defend this level with vigor. The follow-up reversal breached the immediate support of $93, displaying an evening star candle pattern.
Today, the retest phase shows a long-wick rejection candle indicating the intense supply pressure at the higher levels.
The renewed selling could plunge the altcoin by 12%, bringing it to $78.5. However, a confluence of other technical support, i.e., 20 DMA and 0.5 Fibonacci retracement level, suggests the buyers would mount a strong defense at this mark.
On a contrary note, if buyers pushed the coin price above the $93 mark. The resulting fakeout will encourage buyers to rechallenge the $100 resistance.
- Resistance levels: $93 and $100
- Support levels: $78.5 and $63
Technical indicator
A bearish divergence in the daily-Relative Strength Index (73) bolsters a pullback to the following support($78.5)
However, the recovery rally reclaimed a bullish sequence among the DMAs(20, 50, 100, and 200). These DMA lines could assist buyers in continuing the bullish rally.


