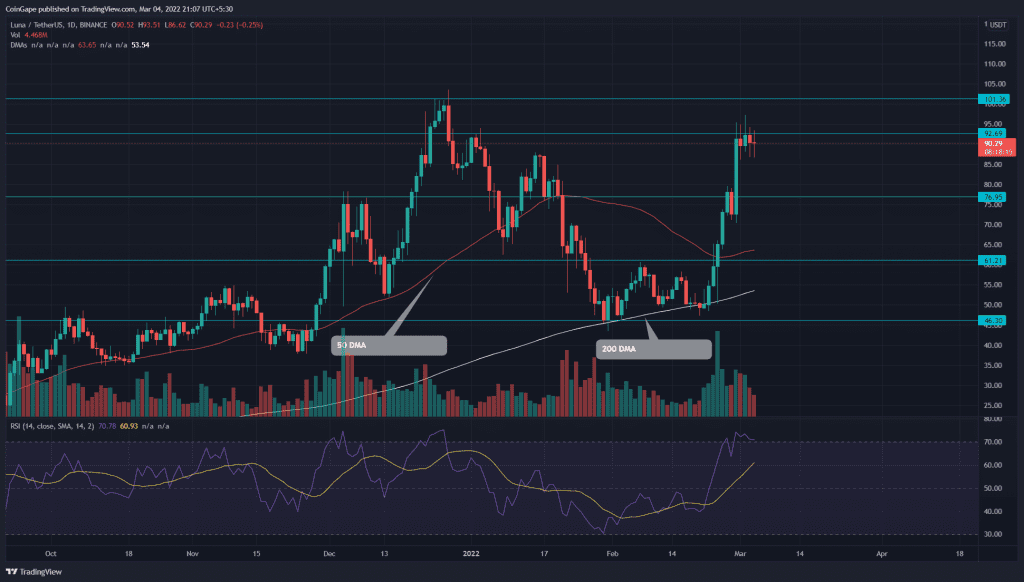
Despite the ongoing uncertainty in the crypto market, Terra (LUNA) coin was one of the top gainers last week, registering a 102% growth from the $47.3 mark. However, the LUNA bulls are struggling to breach an overhead resistance for the past few days, suggesting a possible pullback before the buyers could continue their rally.
Where is LUNA price headed next?
Furthermore, LUNA charts show multiple price rejection candles and diminishing volume activity at the $92 mark, indicating the sellers have mounted a strong defense. If the bears hold the altcoin below this resistance, the selling pressure would accelerate and dump it to lower levels.
Let’s look at charts in detail.
Key points
- The LUNA chart shows several higher price rejections at $92 resistance
- The 20-and-50-DMA completed a bullish crossover.
- The intraday trading volume in the LUNA is $4.6 Billion, indicating a 19.9% loss.
Source- Tradingview
LUNA price recovery struck down two significant resistance of $61.6 and $77 before it hit the $92 mark. The buyers were attempting to knock out this resistance as well, but the second phase of the Russia-Ukraine negotiation pinned down the underlying bullishness in the market.
The expected pullback can plunge the coin price to $77 support. However, a follow-up breakdown would threaten another 20% loss ($61).
Furthermore, the LUNA buyers can expect strong support at the confluence of $61 and 50-day EMA, where the bulls could wrest control from the bear.
- Resistance levels: $92 and $100
- Support levels: $45.6 and $45
Technical indicator
Negative divergence in the 4-hour-Relative Strength Index (73) supports a bearish reversal from the $92.8.
However, the recovery rally surged above the 20, 50, and 100 DMA’s, indicating the buyers have the upper hand. Moreover, a bullish crossover of the 20 and 50 DMA could strengthen their grip.


