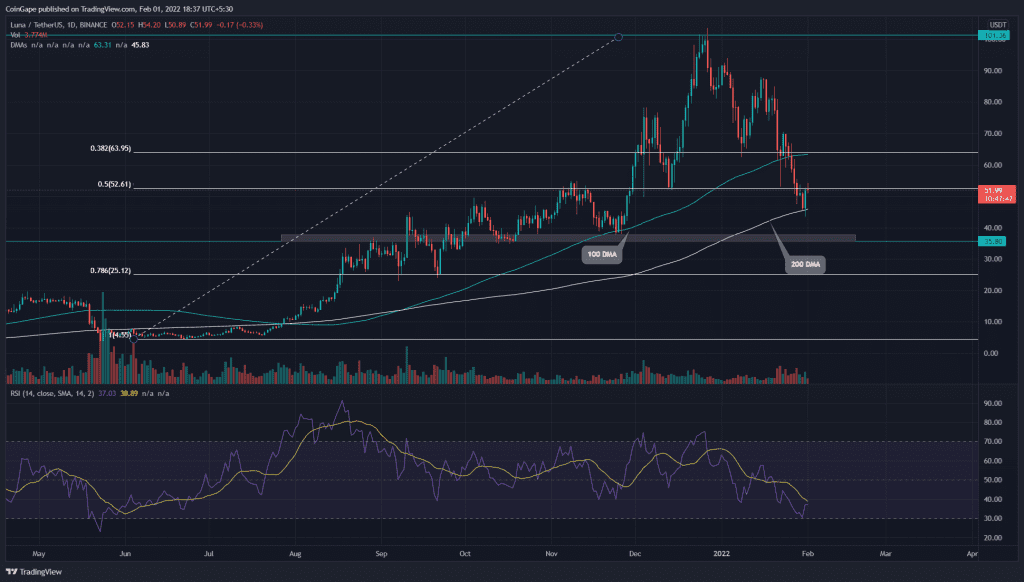
The Terra sellers had tumbled the LUNA price to a new low of $43.6, indicating a 58% devaluation from the All-Time high($103.3). However, the buyers halted the down rally at the 200-day DMA are currently challenging the immediate resistance at $53 to begin a recovery rally.
Key technical points:
- LUNA price obtaining strong support from 200-day DMA
- The Daily-RSI slope approaching the oversold region
- The intraday trading volume in the LUNA is $2.6 Billion, indicating a 31% gain.
Source- Tradingview
In our previous coverage of Terra coin technical analysis, the LUNA buyers were trying to sustain above the shared support of 0.382 Fibonacci retracement and 100 DMA. However, the last week’s intense sell-off plunged the coin price even below the 50% retracement level($52.4).
The buyers showed strong interest at the 200 DMA line($45.5) and pumped the LUNA price to immediate resistance at the $52.4 mark. However, sellers restricting the relief rally to carry ahead may plunge the alt to retest $45.5.
The daily-Relative Strength Index(37) downtrend closing to the oversold region suggests the sellers might have extended the correction.
Can LUNA Price Reclaim The $53 Mark?

Source-Tradingview
If buyers are holding the $45 support, it would indicate the bulls are interested in picking up this dip. As a result, price action might consolidate for a few upcoming sessions. Furthermore, a breakout from either level of this range would continue the following rally.
The Average Directional Index(27) shows a minor pullback due to the recent bullish rally. However, If bears could keep up the selling momentum, the ADX slope would curve up again.
The technical chart indicates the overhead resistance for LUNA price is $53, followed by $63. As for the opposite end, the support levels are at $44.5 and $35.


