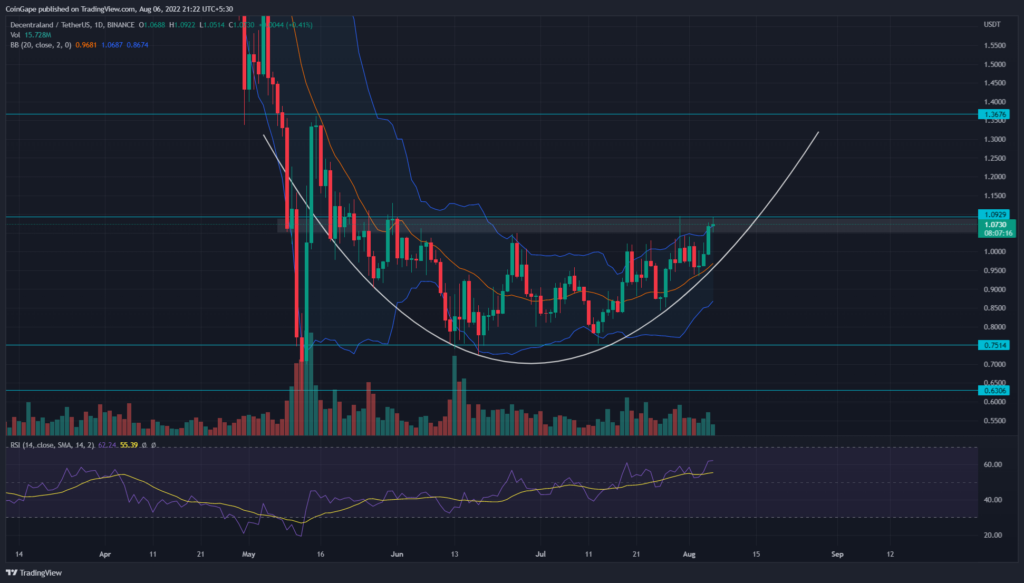
The Decentraland (MANA) price has been on a winning streak for the past four days, accounting for an 11.5% gain. The volume rise during this recovery indicates the traders are confident in rising prices. With sustained buying, the altcoin should escape the past two months’ range rally.
advertisement
Key points:
- The MANA price faces intense supply pressure from the $1.1 resistance
- The 20-and-50-day EMA bullish crossover attracts more buyers in the market.
- The intraday trading volume in the Decentraland Token is $247.9 Million, indicating a 27% loss.
Source-Tradingview
The MANA/USDT technical chart represents an evident example of a rounding bottom pattern. The bullish reversal pattern has completed its early two stages with a Mid-May-to-June downfall, followed by ongoing consolidation in a range-bound rally.
As per the technical set-up, the MANA price should breach the overhead resistance of $1.1 and lead the coin to $1.36
Trending Stories
On July 13th, the MANA price rebounded from the $0.75 bottom support and surged 44.61% within a month. Today, with a 0.88% jump, the coin buyers attempted to end this consolation with a bullish breakout.
However, the daily candlestick closing above the $1.1 neckline resistance within sufficient volume rise is required to confirm this breakout. The post-breakout rally may push the MANA price 26.2% higher to $1.36 resistance.
If the bullish momentum sustains, the altcoin may surpass the ceiling and climb towards the next significant support zone of $1.68.
On a contrary note, if MANA price reverts from the $1.1 resistance, and breakdown from the 20-day EMA will indicate the resumption of the consolidation phase.
Technical indicator
Bollinger band indicator: the recent price jump tags the indicator’s upper band indicates a minor is plausible before the breakout. However, the midline offering dynamic support should maintain the recovery phase.
advertisement
RSI indicator: The daily-RSI slope shows a more substantial rally than price action, indicating the rising bullish momentum. This positive diverger suggests the price should eventually breach this $1.1 resistance.
- Resistance level: $0.935, $0.75
- Support level: $1.1, $1.36


