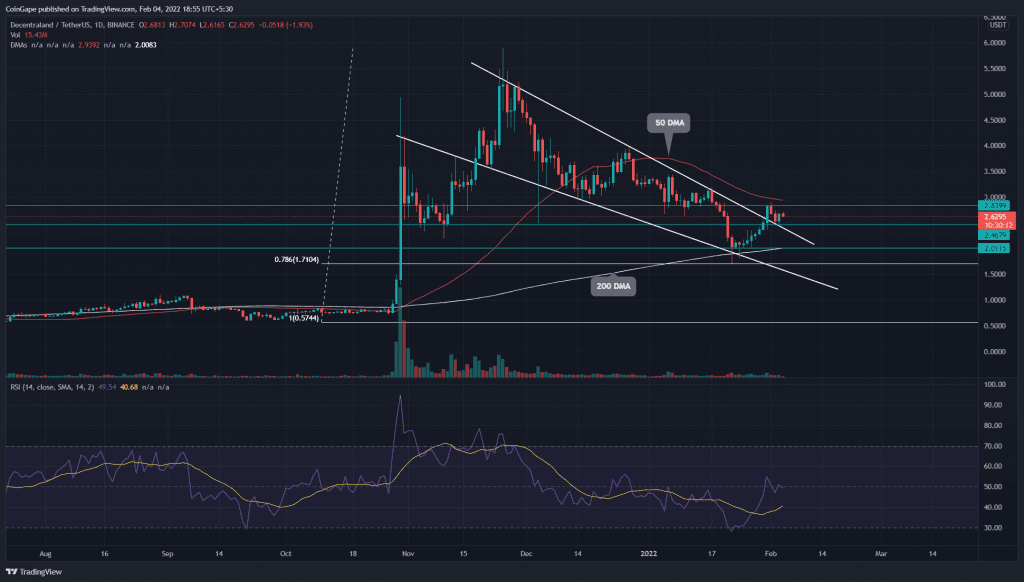
The MANA/USD pair has seen a significant rebound over the past week, suggesting a respite from the correction phase. Moreover, the technical chart accentuates the current recovery by revealing a cup and handle pattern. This pattern should help decentraland buyers to breach the weekly resistance of $2.9.
Key technical points:
- The Decentraland (MANA) buyers flipped the dynamic 20 DMA resistance to support.
- The intraday trading volume in the MANA is $4.9 Billion, indicating a 27% fall.
Source- Tradingview
During the correction phase in Decentraland (MANA) price, the alt price was resonating in a falling wedge pattern in the daily time frame chart. This pattern has helped bears to sell at rallies and tumbled the coin to 0.786 Fibonacci retracement level($1.7).
However, during the last week of January, the buyers made a 40% price recovery from the $2 support. The coin price pierced through the pattern’s resistance trendline and reached $2.88 by the month-end.
The MANA/USD buyers managed to sustain the coin price above 200 DMA, indicating the bullish trend remained intact. Moreover, the recent recovery has flipped the 20 DMA into a possible support level.
The daily-Relative Strength index(48) assists this rally with an impressive recovery from the oversold region.
MANA Price Displays A Cup And Handle Pattern

Source- Tradingview
The V-Shaped recovery in price action shows the formation of a cup and handle pattern. The Decentraland (MANA) price structuring the handle portion of this pattern should lead the price to the $2.9 neckline.
A bullish breakout and daily-candle closing above the combined resistance of 50 DMA and $2.9 would provide a 20% rally to the $3.5 mark and a better confirmation for a recovery rally.
However, if buyers couldn’t sustain the handle portion above the $2.45, the alt will sink to the $2 mark, which should confirm buyers’ interest at this support.
- Resistance levels- $2.9 and $3.5
- Support levels- $2.45 and $2


