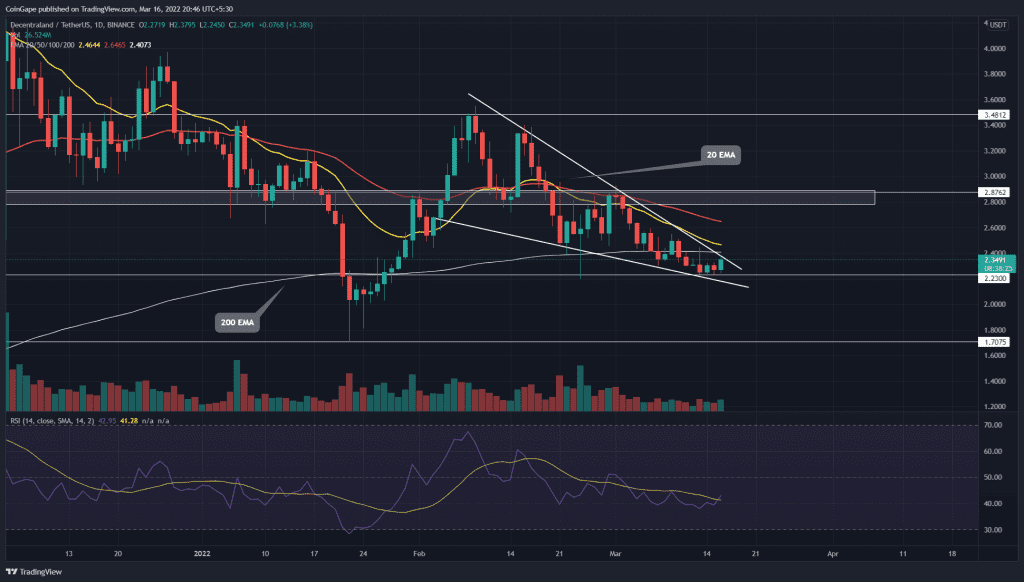
On Wednesday, the Decentraland(MANA) price turned green, displaying a 3.66% intraday. The bullish candle retests the resistance trendline of the falling wedge pattern, attempting a bullish breakout. However, the buyers would face multiple resistance on its path, trying to limit the potential rally.
Key points:
- The declining 20-day EMA could soon nosedive below the 200-day EMA
- MANA price is poised to break out of the wedge formation.
- The 24-hour trading volume in the Decentraland token is $477 Million, indicating an 82.5% gain.
Source-Tradingview
The Decentraland(MANA) price showcased a slow and steady downfall within the falling wedge pattern. The correction phase started from the $3.5 level and has discounted the altcoin by 37%, hitting the $2.2 support.
This reversal pattern could kickstart a recovery rally once the price gives a genuine breakout from the overhead resistance. As price action narrows inside the wedge, we are likely to see a breakout soon.
However, the technical chart shows the buyers need to overcome a confluence of resistance levels such as the descending trendline, 20 and 200 EMA. If they succeed, the bullish rally will hit a 22% high resistance of $2.88, followed by the $3.5.
The coin holders are exposed to a bearish breakdown until the pattern is intact, indicating a 22% downside risk.
Technical indicator
The MANA price has recently nosedived below the 200-day EMA, indicating a bearish tendency. Moreover, a potential negative crossover among the 20-and-200 EMA could bolster a bearish fallout.
The Relative Strength Index slope travels a sluggish rally below the neutral zone, maintaining negative sentiment among traders.
- Resistance level: $2.5, and $2.88
- Support level: $2.22, and $1.7


