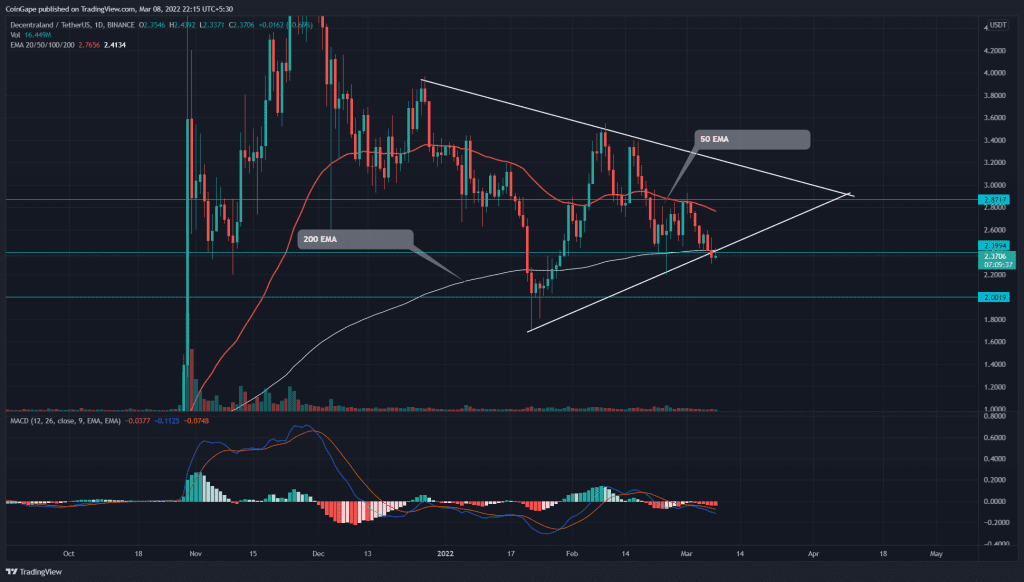
On March 7th, the Decentraland(MANA) sellers took the final leap and breached the continuation symmetrical triangle pattern. Today, the coin price gives a retest to the breached support where the long-wick rejection candle suggests a potential 15% fall.
Key points:
- The MANA chart shows higher price rejection at its flipped $2.4 resistance
- The 24-hour trading volume in the Decentraland token is $430 Million, indicating an 8% gain.
Source-Tradingview
Over the past two months, the MANA/USD pair resonated within a symmetrical triangle pattern. Furthermore, the recent correction phase initiated from the February 9th high($3.54) devalued the altcoin by 33% and plunged to the $2.4 support.
The coin chart shows a confluence of important technical support at the $2.4 level, i.e., the 200-day EMA and ascending trendline. The bulls were expected to defend this support and drove the price higher; however, on March 7th, a bearish breakdown from this level indicated the triangle pattern revolved in the bear’s favor.
Today the MANA price turned green, and tried to reentry the triangle pattern. However, the sellers immediately rejected the coin price, and the long-wick candle formation highlights that the support has flipped to support.
The renewed selling pressure could slump the altcoin by16%, bringing it back to the January low support at $2.
Alternately, If the buyers could push the coin price above the $2.4 mark, the resulting fakeout would surge the price to $2.8.
Technical Indicator
The buyers lost their last line of EMA defense(i.e., 200), providing an excellent edge for short-sellers. Moreover, a negative crossover of the 50 and 100 EMA intensifies the selling momentum.
The MACD indicator shows that the fast and slow are gradually lower in the bearish territory, indicating the sellers dominate.
- Resistance level: $2.4 , $2.8
- Support level: $2, $1.7


