Disclaimer: The findings of the following analysis are the sole opinions of the writer and should not be considered investment advice
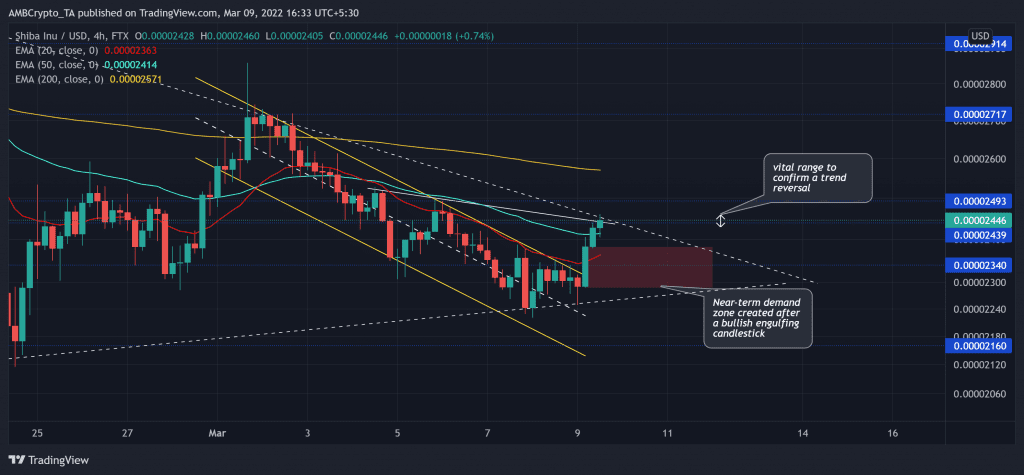
Shiba Inu (SHIB) saw a brief consolidation between the $0.034 and $0.018-levels for over two months. The buyers are now building up tension at its three-week trendline resistance (white, dashed). Here, do note that for brevity, SHIB prices are multiplied by 1000.
If the sellers reject higher prices in the current range, SHIB will position itself for a near-term pullback towards its immediate demand zone. Following the same, any close above $0.02439 would help the alt recover towards the $0.025-zone.
At press time, SHIB was trading at $0.02446, up by 4.45 % in the last 24 hours.
SHIB 4-hour Chart
As soon as the alt hit its three-month low on 22 January, the buyers took charge at the $0.018-mark, as they have for the last five months. Soon after, SHIB bulls initiated a rally that led the alt to double its value before reversing from its long-term ceiling of $0.034-level.
As a result, the bulls have ensured higher troughs while the bears kept the peaks in their influence. This contributed to the formation of a symmetrical triangle-like pattern in the last two months.
Recent movements have favoured the bulls as SHIB broke out of its down-channel (yellow) and crossed its 20/50 EMA. Also, the 20 EMA (red), now looking north, affirmed the near-term bullish advantage.
Now, $0.024 is a critical zone for the buyers to topple for them to claim a solid edge. Any close below this level would confirm the existence of a hidden bearish divergence and would stall the buying spree. The pullback would continue to rest at its demand zone before the buyers yet again challenge the trendline resistance.
Rationale
The RSI’s upturn from its oversold territory only saw the 40-mark hurdle in its swift recovery above the midline. Any close below its trendline resistance would reaffirm the hidden bearish divergence.
Nevertheless, the CMF crossed the zero line and pictured a buying edge. Also, the DMI reiterated the bullish edge, but its ADX projected a weak directional trend for SHIB.
Conclusion
The $0.024-zone is vital for the buyers to conquer for the recovery to test its 200 EMA (yellow). Before that, SHIB could likely enter into a tight phase between the $0.022 and $0.023-levels.
Besides, the meme-coin shares a staggering 80% 30-day correlation with Bitcoin. Thus, keeping an eye on the king coin’s movement remains essential for a profitable move.


