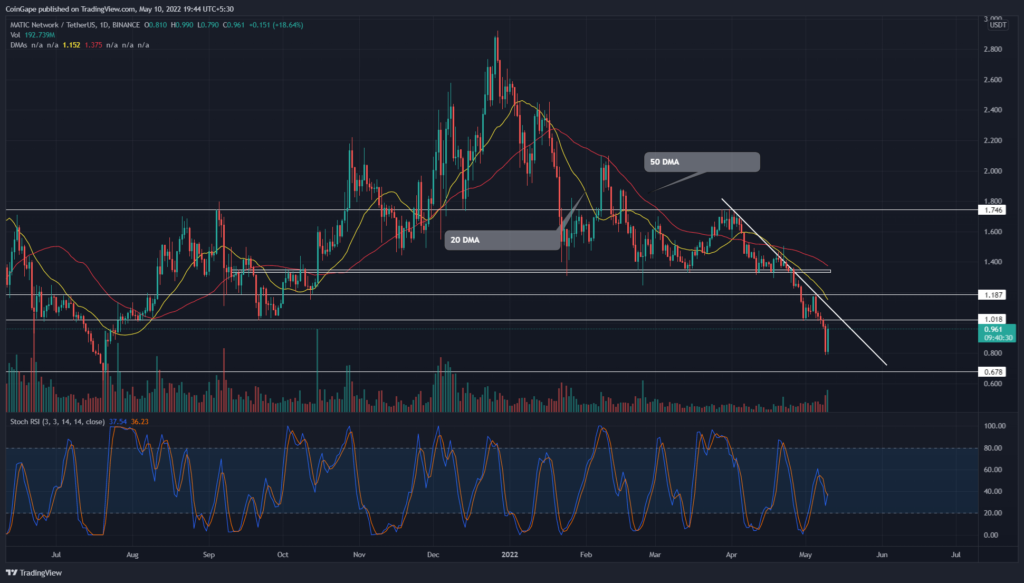
The Polygon(MATIC) traders actively selling on a descending trendline tumbled the coin price by 53.5% from the $1.73 high. Last weekend the MATIC price breached $1 physiological support suggesting the sellers are preparing for another leg down. Can the evident bullish divergence on indicators bolster the price to reclaim the $1 mark?
Key points
- High volume retest shows strength in bullish momentum
- The daily-stochastic RSI hints potential bullish crossover
- The intraday trading volume in MATIC is $1.67 Billion, indicating a 136.5% gain.
Source- Tradingview
On April 26th, the ongoing sell-off in the crypto market made MATIC price lose multi-month support of $1.35. Furthermore, the accelerated selling continued the bear attack at full throttle and knocked out more support levels such as $1.2 and $1.
The post retest fall depreciated the MATIC price by 39% as it reached the current low of $0.8. Anyhow, the altcoin has recently breached the $1 psychological support on May 8th, suggesting further correction in the price
Today the MATIC price experienced a sudden pump of 20% and retested the breached $1 support. If sellers hold the coin price below the $1 and the highly influential resistance trendline, the traders can expect a free fall to the $0.68 mark.
Trending Stories
On a contrary note, an unexpected rise in bullish momentum could breach the falling resistance and ignite a recovery opportunity. The potential rally would surge the coin price to the $1.4 mark, reflecting 44% growth.
Technical Indicators
A bearish sequence of the falling DMAs(20, 50, 100, 200) reflects an overall bear trend. These DMAs give additional hurdles for a potential rally.
The long bullish divergence on the stochastic RSI chart suggests rising bullish momentum. Moreover, the K and D line nearing a bullish crossover encourages additional buying.
- Resistance levels- $1 and $1.18
- Support levels- $0.8 and $0.67


