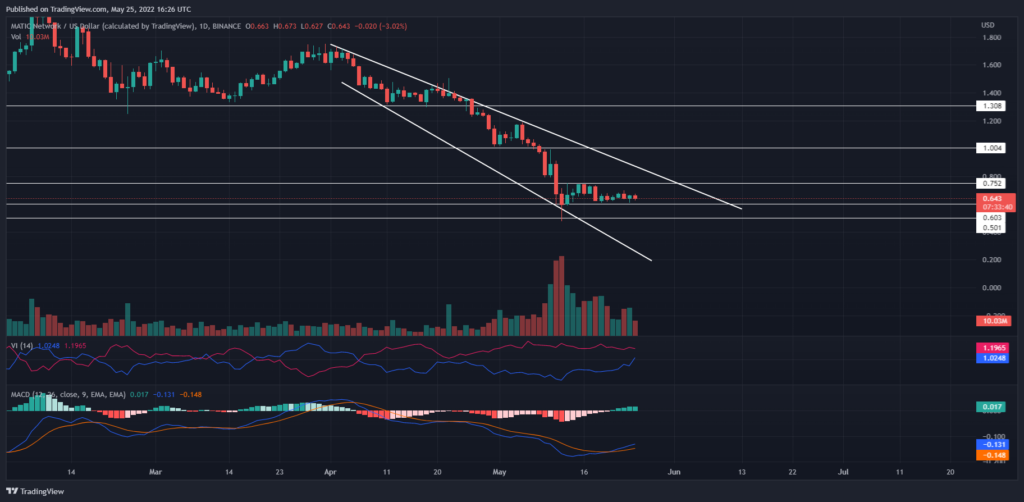
The MATIC price saw a sharp rise from $0.50 to the overhead resistance at $0.75, but the uptrend struggled to rise above, leading to a lateral shift. However, the crucial support level of $0.60 keeps the bearish pressure under check and increases the chances of an uptrend.
Key points:
- The MACD indicator’s bullish crossover projects a buy signal
- With a 65% drop in the market value, MATIC price undergoes consolidation.
- The intraday trading volume in the Polygon is $473 Million, indicating an 11.53% drop.
Source- MATIC/USD chart by Tradingview
April being the extremely bearish month for Polygon(MATIC), it experienced a sharp reversal from the $1.68 and plunged to $0.50. However, the May month brought relief for buyers as the downfall led to a lateral shift after a $0.75 retest.
Being trapped under low range movement, the trend momentum coils up and awaits a jump in trading volume to be released. Hence, traders can expect a sharp move on either side.
Trending Stories
The consolidation comes due to the lack of traders’ interest; however, a surge in high-leverage positions can increase the volatility, depending on the breakout.
Today, the MATIC price is up by 1.05% and shows a lower price rejection candle.
A bullish breakout of the consolidation range can breach the $0.75 mark and test the next overhead resistance at $1.
On the opposite end, if sellers pull the altcoin below the $0.60 mark, the resulting fallout will plunge the altcoin under $0.050.
Technical indicator-
A bullish crossover of the MACD and signal line encourages the entry of new MATIC buyers, evident by the rising trend of bullish histograms.
The MATIC price shows a growth in the underlying demand as the VI lines of the Vortex indicator approach each other to give a bullish crossover.
- Resistance level- $0.75, and $1
- Support level- $0.60 and $0.50


