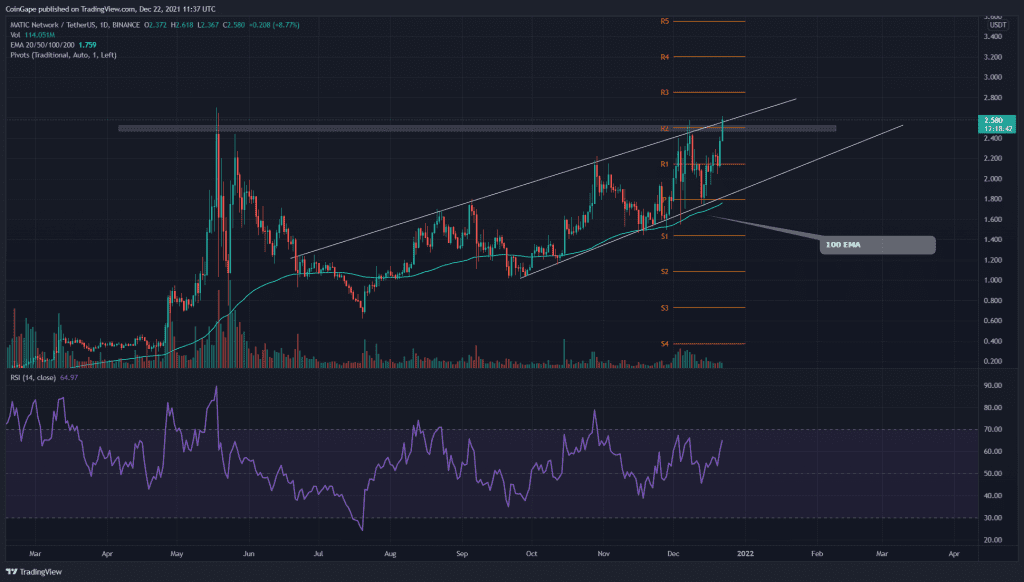
The MATIC coin chart shows a steady technical rally with new highs and higher lows. Today the coin is up by 10% and is trying to breach the ATH resistance of $2.5. Reclaiming this crucial level, the coin could ride a stronger rally.
Key technical points:
- The 100-day EMA line provides excellent dynamic support to the price
- The daily RSI chart struggling to keep up with the bullish price action
- The 24-hour trading volume in Polygon coin is $3.04 Billion, indicating a 43.1% gain.
Source-Tradingview
Previously we mentioned in our Polygon coin article; the pair was resonating in a rising parallel channel pattern. This pattern’s support trendline has been shifted a bit higher due to the rising bullishness in the coin.
On 14th December, the coin price bounced from the bottom trendline, initiating an impressive V-shaped recovery. The price is up by 45% and ready to challenge the ATH resistance around $2.5.
According to the EMA levels( 20, 50, 100, and 200), the MATIC price maintains a bullish trend. Moreover, the coin price obtains dynamic support from the 100 EMA line.
The daily Relative Strength Index (65) projects a bullish sentiment among the market buyers. However, the RSI line lagged up compared to the price action.
MATIC/USD 4-hour time frame chart
Source- Tradingview
Today, the MATIC coin provides a decisive breakout from the crucial horizontal resistance and the ascending trendline together. If the price sustains above these levels, the crypto traders can expect a strong rally in this coin.
The traditional pivot shows remarkable confluence with the known price action level of the technical chart and, therefore, can provide a good hint of possible resistance level above. As per these EMAS, the nearest resistance area is $2.8, followed by $3.2.
The Moving average convergence divergence indicator for the 4-hour chart shows the fast line(blue) and slow line(orange) are moving higher up in the bullish zone.


