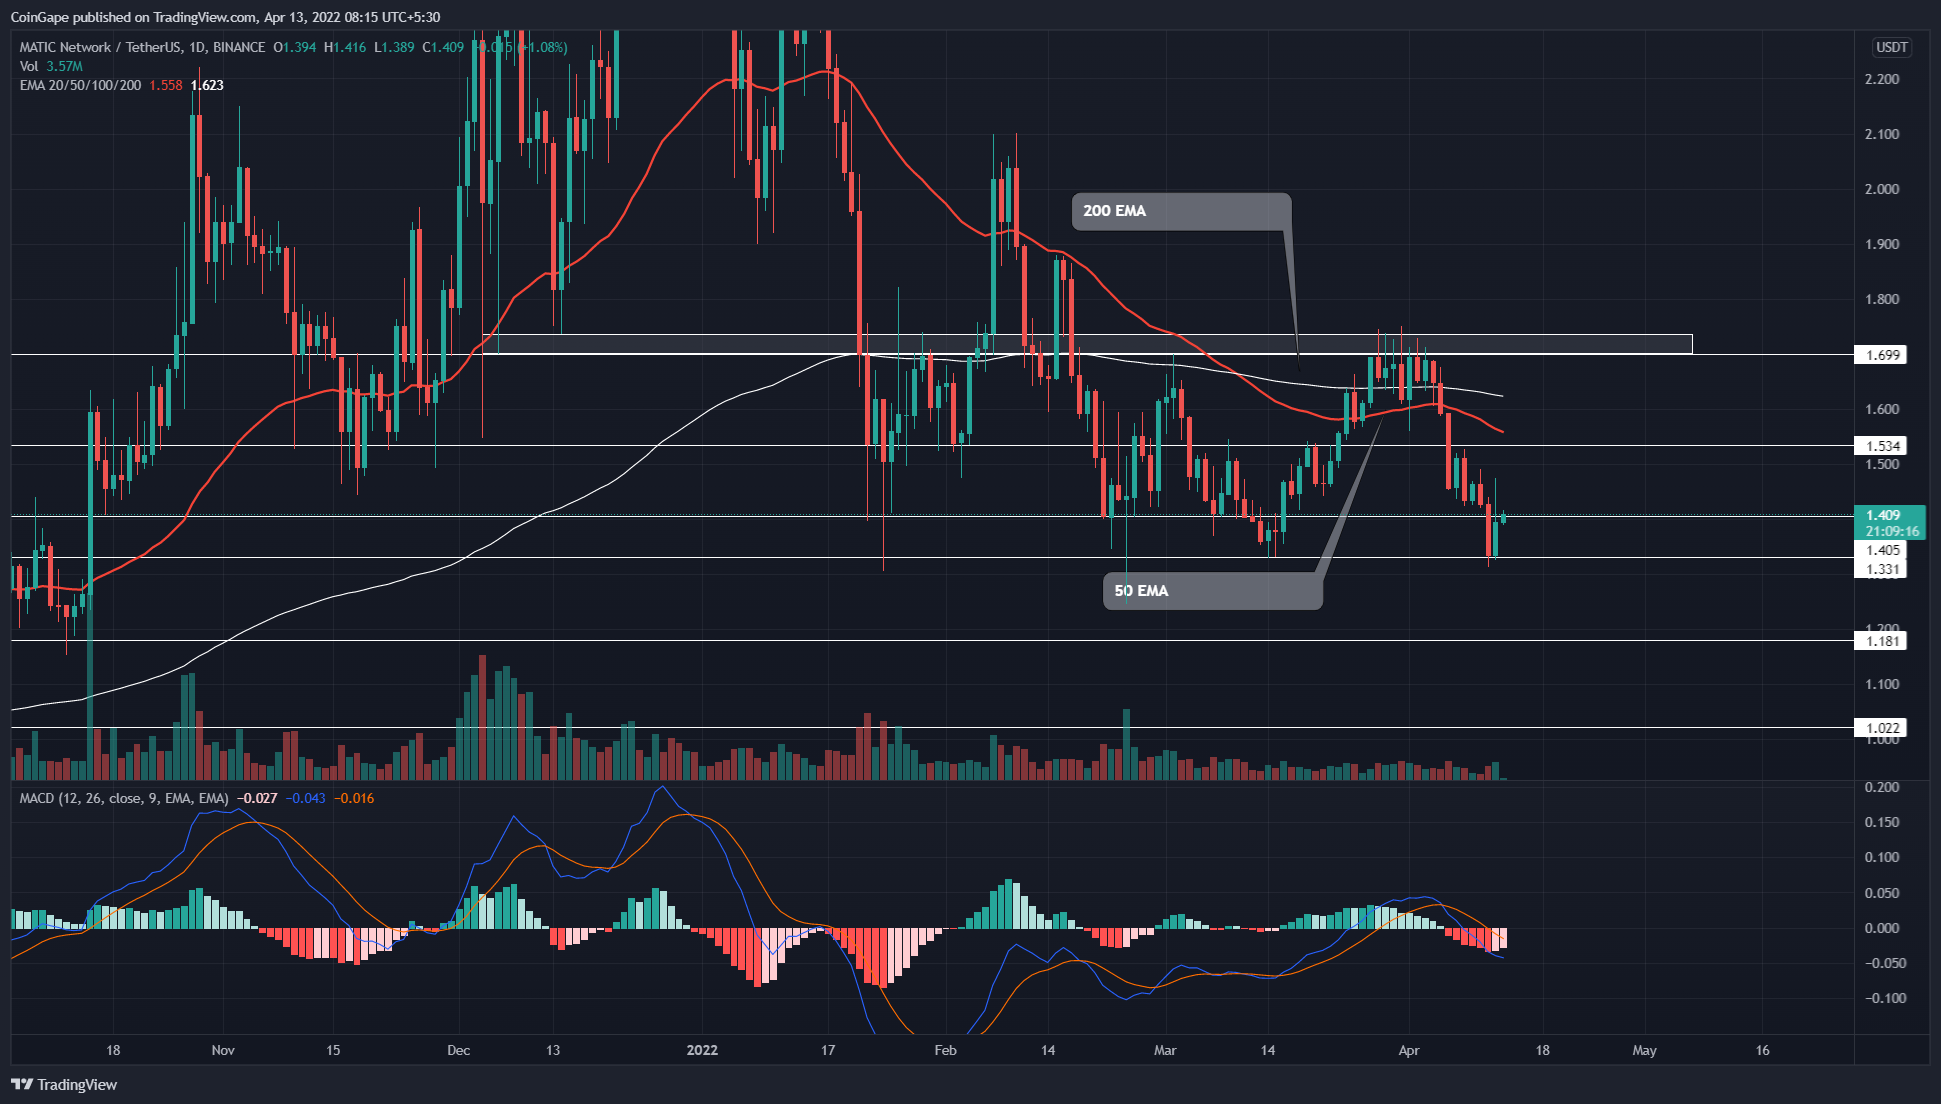
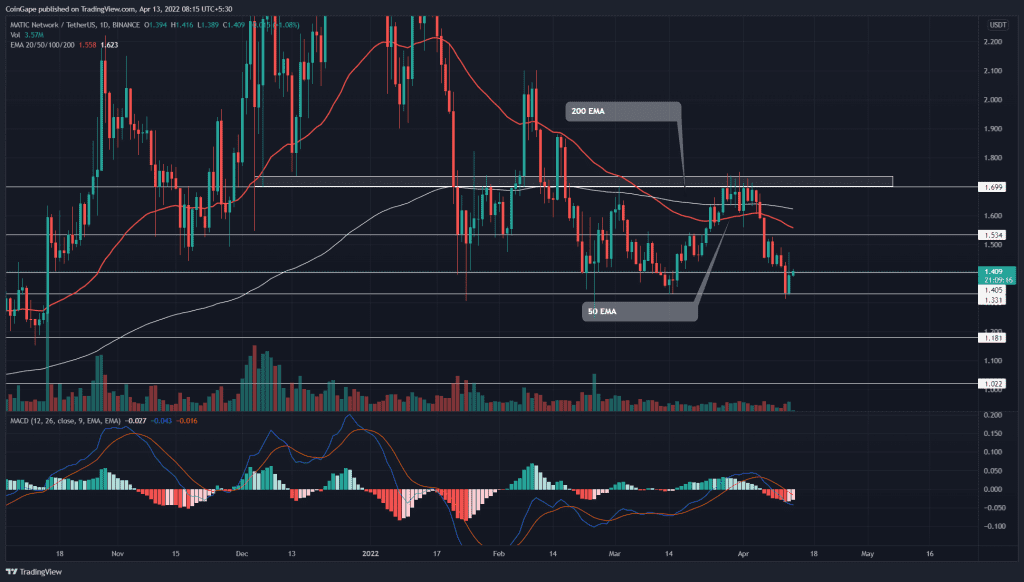
The Polygon(MATIC) coin getting listed on the trading platform Robinhood triggered a significant inflow on April 12th. Amidst the announcement, the MATIC price reached a high of the $1.475 mark, indicating a 10.75% intraday gain. However, the buyers obtained strong rejection at a higher price, forcing the coin price below the $1.4 resistance.
Key points
- The MATIC price rebounded from the $1.33 support
- The downsloping 100-day EMA hints at a bearish crossover with the 200-day EMA
- The intraday trading volume in MATIC is $797.5 Million, indicating a 19.7% gain.
 Source- Tradingview
The V-shaped recovery initiated from the $1.35 support surged the Polygon(MATIC) price by 28.5%. The bulls knocked out some significant resistance levels, such as $1.4 and 1.53, before hitting the $1.7 weekly resistance.
However, amid uncertainty across the crypto market in march end, the coin buyers struggled to surpass the $1.7 resistance. As a result, the sellers eventually wrested control from buyers and lowered the coin price.
The MATIC price plunged to $1.33 support as the new bear cycle wiped out all gains acquired during the last recovery. Moreover, the aggressive selling in the market may tease a bearish breakdown from the bottom.
However, Last quarter the MATIC price couldn’t move past the $1.33 support due to the presence of strong demand pressure. Therefore, the potential buyers should wait for reversal signs at this support before entering the market.
Technical Indicators
The flattish 100-and-200-day EMA signals a sideways rally for MATIC. However, the slight decline in these EMAs suggests the sellers are aggressive at the current time.
The MACD indicator signals weakness in the bearish momentum as the gap between the MACD and signal lines shrunk. Moreover, a potential bullish crossover could indicate a buying opportunity for traders.
- Resistance levels- $1.5 and $1.7
- Support levels- $1.4 and $1.35


