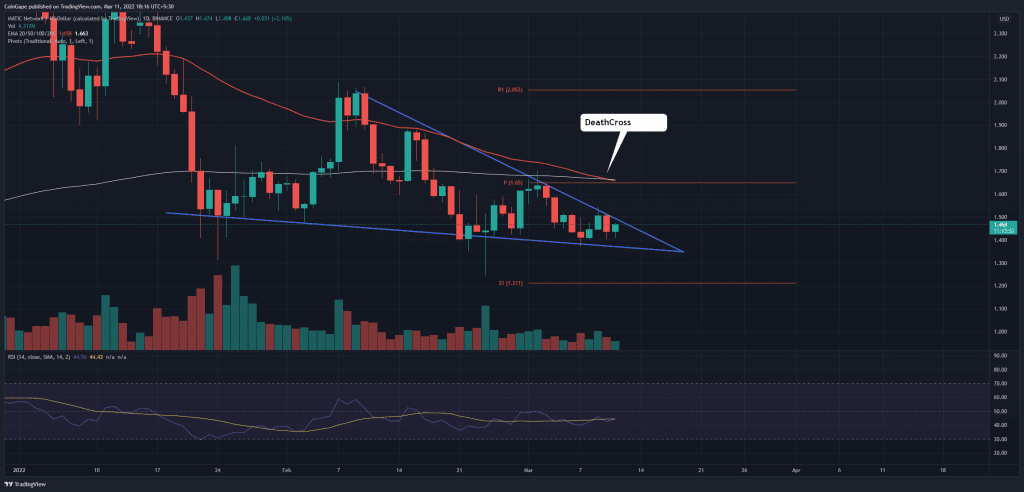
The MATIC price gave a bearish candle from the wedge pattern’s utmost resistance trendline resulting in a 4.64% fall. However, the anticipation of a bearish continuation was sabotaged by the lower price rejection followed by a jump of 1.65%.
Key technical points:
- Polygon price trend remains trapped within the falling wedge.
- The bullish retracement within the bearish pattern hints further recovery
- The crucial EMAs in the daily chart gives a dearth cross.

Source- Tradingview
The MATIC/USD daily chart shows a falling wedge pattern with the price trending below the psychological mark of $1.50. The downtrend fills the falling wedge indicating a breakout rally shortly.
.OffersRow {
display: flex;
flex-wrap: wrap;
}
.offersads{ display:none;}
.Optile {
text-transform: uppercase;
font-weight: 700;
font-size: 16px;
margin: 0 0 14px;
padding: 0 5px;
text-align: left;
}
.offerDv {
padding: 25px 8px 10px;text-align: left;
}.offersads {
padding: 0 13px;
margin: 0 -15px;
background: #f4f4f4;
padding: 20px 5px;
}
.twitter-tweet .offersads {
margin: 0 -40px;
padding-bottom: 20px;
}
.OffersRow .Items {
width: calc(33.3% – 10px);
margin: 0 5px;font-family: montserrat,sans-serif !important;
background: #fff; border-radius: 4px;
box-shadow: 0 1px 3px 0 rgba(0, 0, 0, 0.13);
position: relative;
overflow:hidden;
}
.Items span {background: #0aac29;color: #fff;position: absolute;left: 0;top: 0;border-radius: 0px 0px 2px 0px;padding: 0 12px; font-size:12px;}
.OffersRow .h5ad {
font-weight: 600 !important;
color: #1a419a !important;
font-size: 15px !important;margin:0 !important;
}
.offerSd {
color: #222222;
font-size: 12px;
font-weight: 500;
}
.GetthisDeal a {
display: block;
text-align: center;
font-weight: 600; font-size: 12px;
color: #079321;
}
.GetthisDeal {
border-top: 1px dashed #9b9b9b;
padding: 8px 0 0 0;
margin: 10px 0 0;
}
@media(max-width:600px){
.offersads{display:block;} }
The opposing trendlines seem to be of equal strength as they have kept the trend momentum trapped for more than a month now. Therefore, the breakout of either side will result in a significantly volatile move.
The death cross of the 50 and 200-day EMA project a rise of bearish influence of the price pattern and increases the chances of fallout.
Despite multiple attempts, the daily RSI slope shows a flattish movement with a bearish nudge as it fails to rise above the 50% mark.
MATIC/USD: Weekly Timeframe Chart


Source- MATIC/USD chart by Tradingview
The MATIC/USD weekly chart shows Doji formations near the 50-period EMA at $1.41. A potential bearish wedge breakout in the daily chart will result in the 50-week EMA fallout. Therefore, a downfall move of almost 30% is possible.
The MATIC price action squeezes between the descending trendline and stiff support at $1.4. The buyers need to breach and sustain above the dynamic resistance to obtain their first sign of recovery.
- Resistance levels- $2 and $2.4
- Support levels- $1.33 and $1


