This year has been over-optimistic for certain coins; Polygon and Fantom have topped that list. With MATIC securing a fresh all-time high, Fantom also continues to eye higher resistance levels. MATIC soared around 30% in the last week while Fantom gained a whopping 62% in that same time frame.
At press time, MATIC was trading at $2.83 while Fantom was priced at $2.62. The trading volume of these coins dipped, indicating low market liquidity, which also signifies volatility in the market.
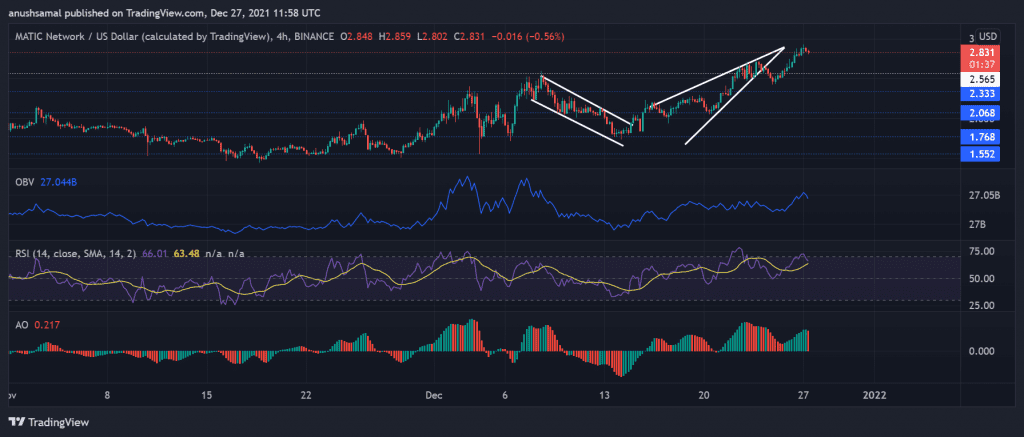
MATIC/USD Four-Hour Chart
Matic had formed an ascending triangle, and soon the coin broke above it. The coin was priced at $2.83 with an immediate resistance at the $3 mark at press time.
The digital currency had breached support lines after the other and secured robust support at $2.06. This powerful price rally that Matic has exhibited could cause the coin to test the immediate resistance and stay above the $2 mark by the end of this year.
The technicals of the coin have reflected bullishness; however, the chances of a corrective pullback owing to higher volatility cannot be ruled out.
The Relative Strength Index was just below the overbought line as buyers exhibited a steep increase in numbers. The On Balance Volume too depicted falling selling pressure in the market. Awesome Oscillator displayed amplified green signal bars as the coin was highly bullish.
FTM/USD Four-Hour Chart
Fantom was trading within an ascending trendline while up by above 60% in the past week. Immediate support level in case of a reversal rested at $2.11. If the uptrend continues to hold this momentum, the coin will trade above the $2 mark at the end of December.
The overhead resistance stood at $2.63, toppling over, which could push FTM to trade near the $3 price mark. The bulls seemed charged from the near-term technicals.
On Balance, Volume registered a climb as buyers re-entered the market since December 20. The Relative Strength Index was above the 80-mark, which meant that the coin was overbought and overvalued owing to a massive rally.
However, the Directional Movement Index indicated that the current market trend was strong as the Average Directional Index was way above the 40-mark, along with which the +DI had crossed over the -DI line indicating a bull run.


