In this article, BeInCrypto takes a look at the seven altcoins that decreased the most over the past week, more specifically from Dec 17 to 24.
These altcoins are:
- OKB (OKB) : -7.21%
- Waves (WAVES) : -6.63%
- Mdex (MDX) : -6.28%
- Votager Token (VGX) : -2.68%
- Function X (FX) : -1.47%
- Polkastarter (POLS) : -1.13%
- SwissBorg (CHSB) : -0.51%
OKB
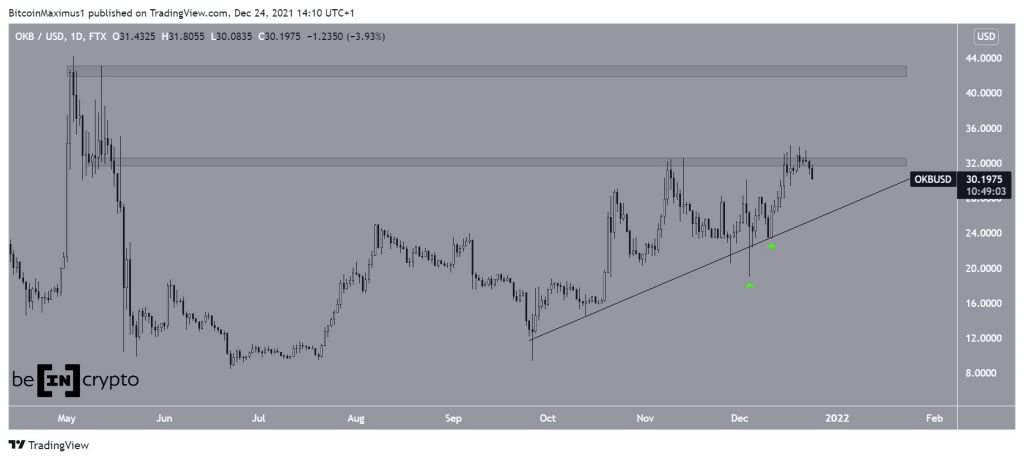
OKB has been increasing alongside an ascending support line since Sept 26. More recently, it bounced above this line twice, on Dec 4 and 11 (green icons).
Afterwards, it resumed its upward movement and is currently making an attempt at breaking out above the $32 horizontal resistance area. It has not traded above this level since May.
Whether the token breaks out above this resistance area or breaks down from the ascending support line will likely determine the direction of the future trend.
The next resistance area is at the $42 all-time highs.
WAVES
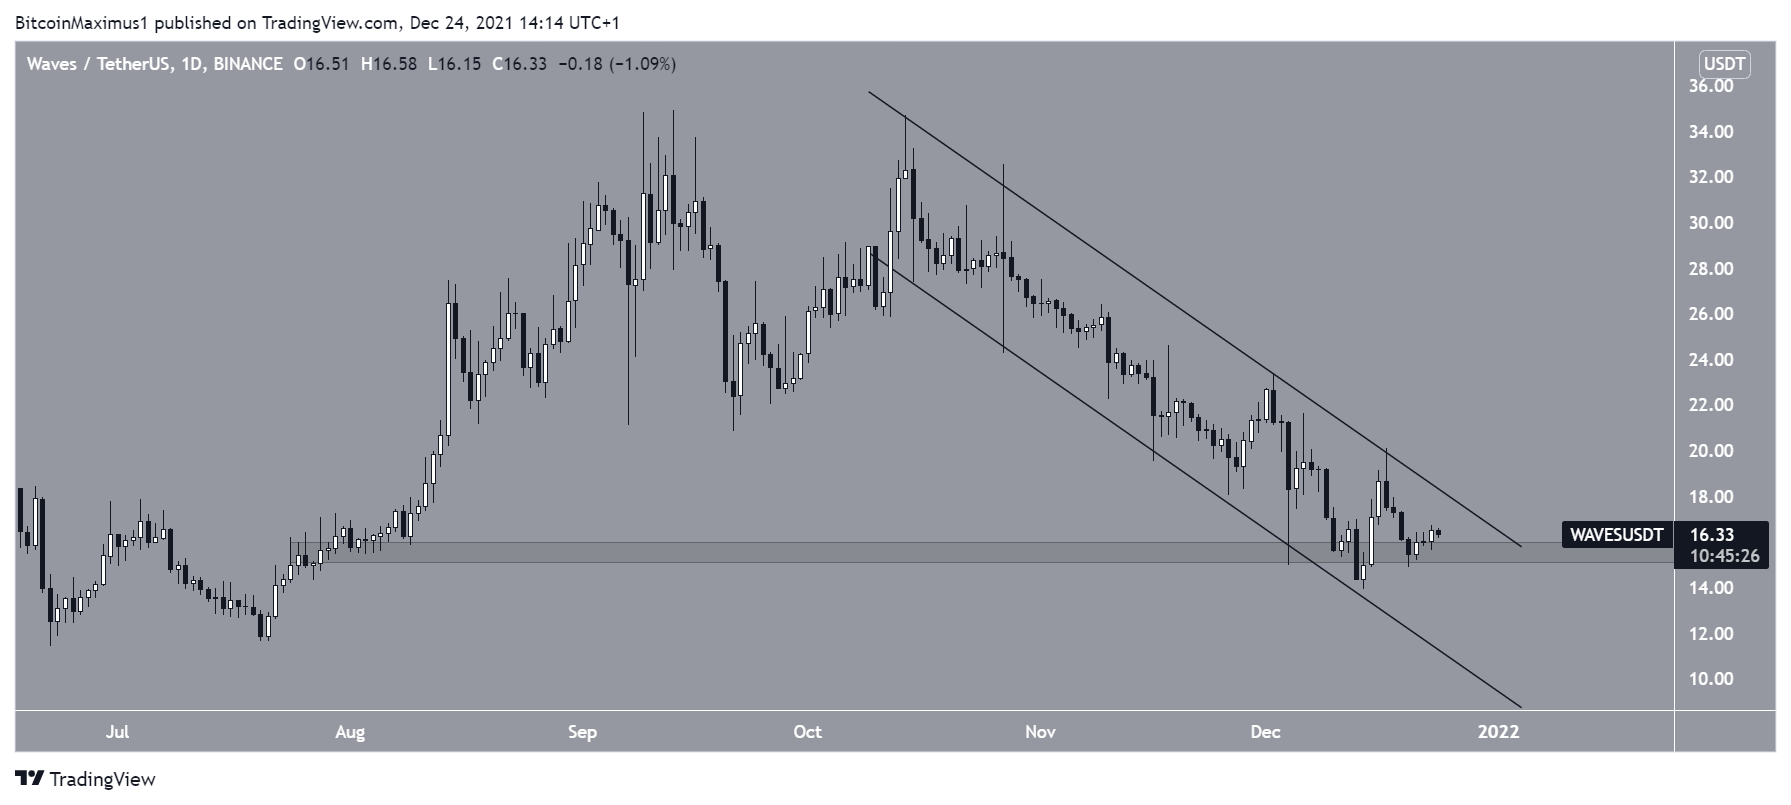
WAVES has been decreasing alongside a descending parallel channel since Oct 24. Such channels usually contain corrective movements, meaning that an eventual breakout from it would be likely.
On Dec 4, the token seemingly broke down from the $15 horizontal area. However, it reclaimed it shortly afterwards and is back at the resistance line of the channel once more.
A breakout from this pattern would likely accelerate the rate of increase.
MDX
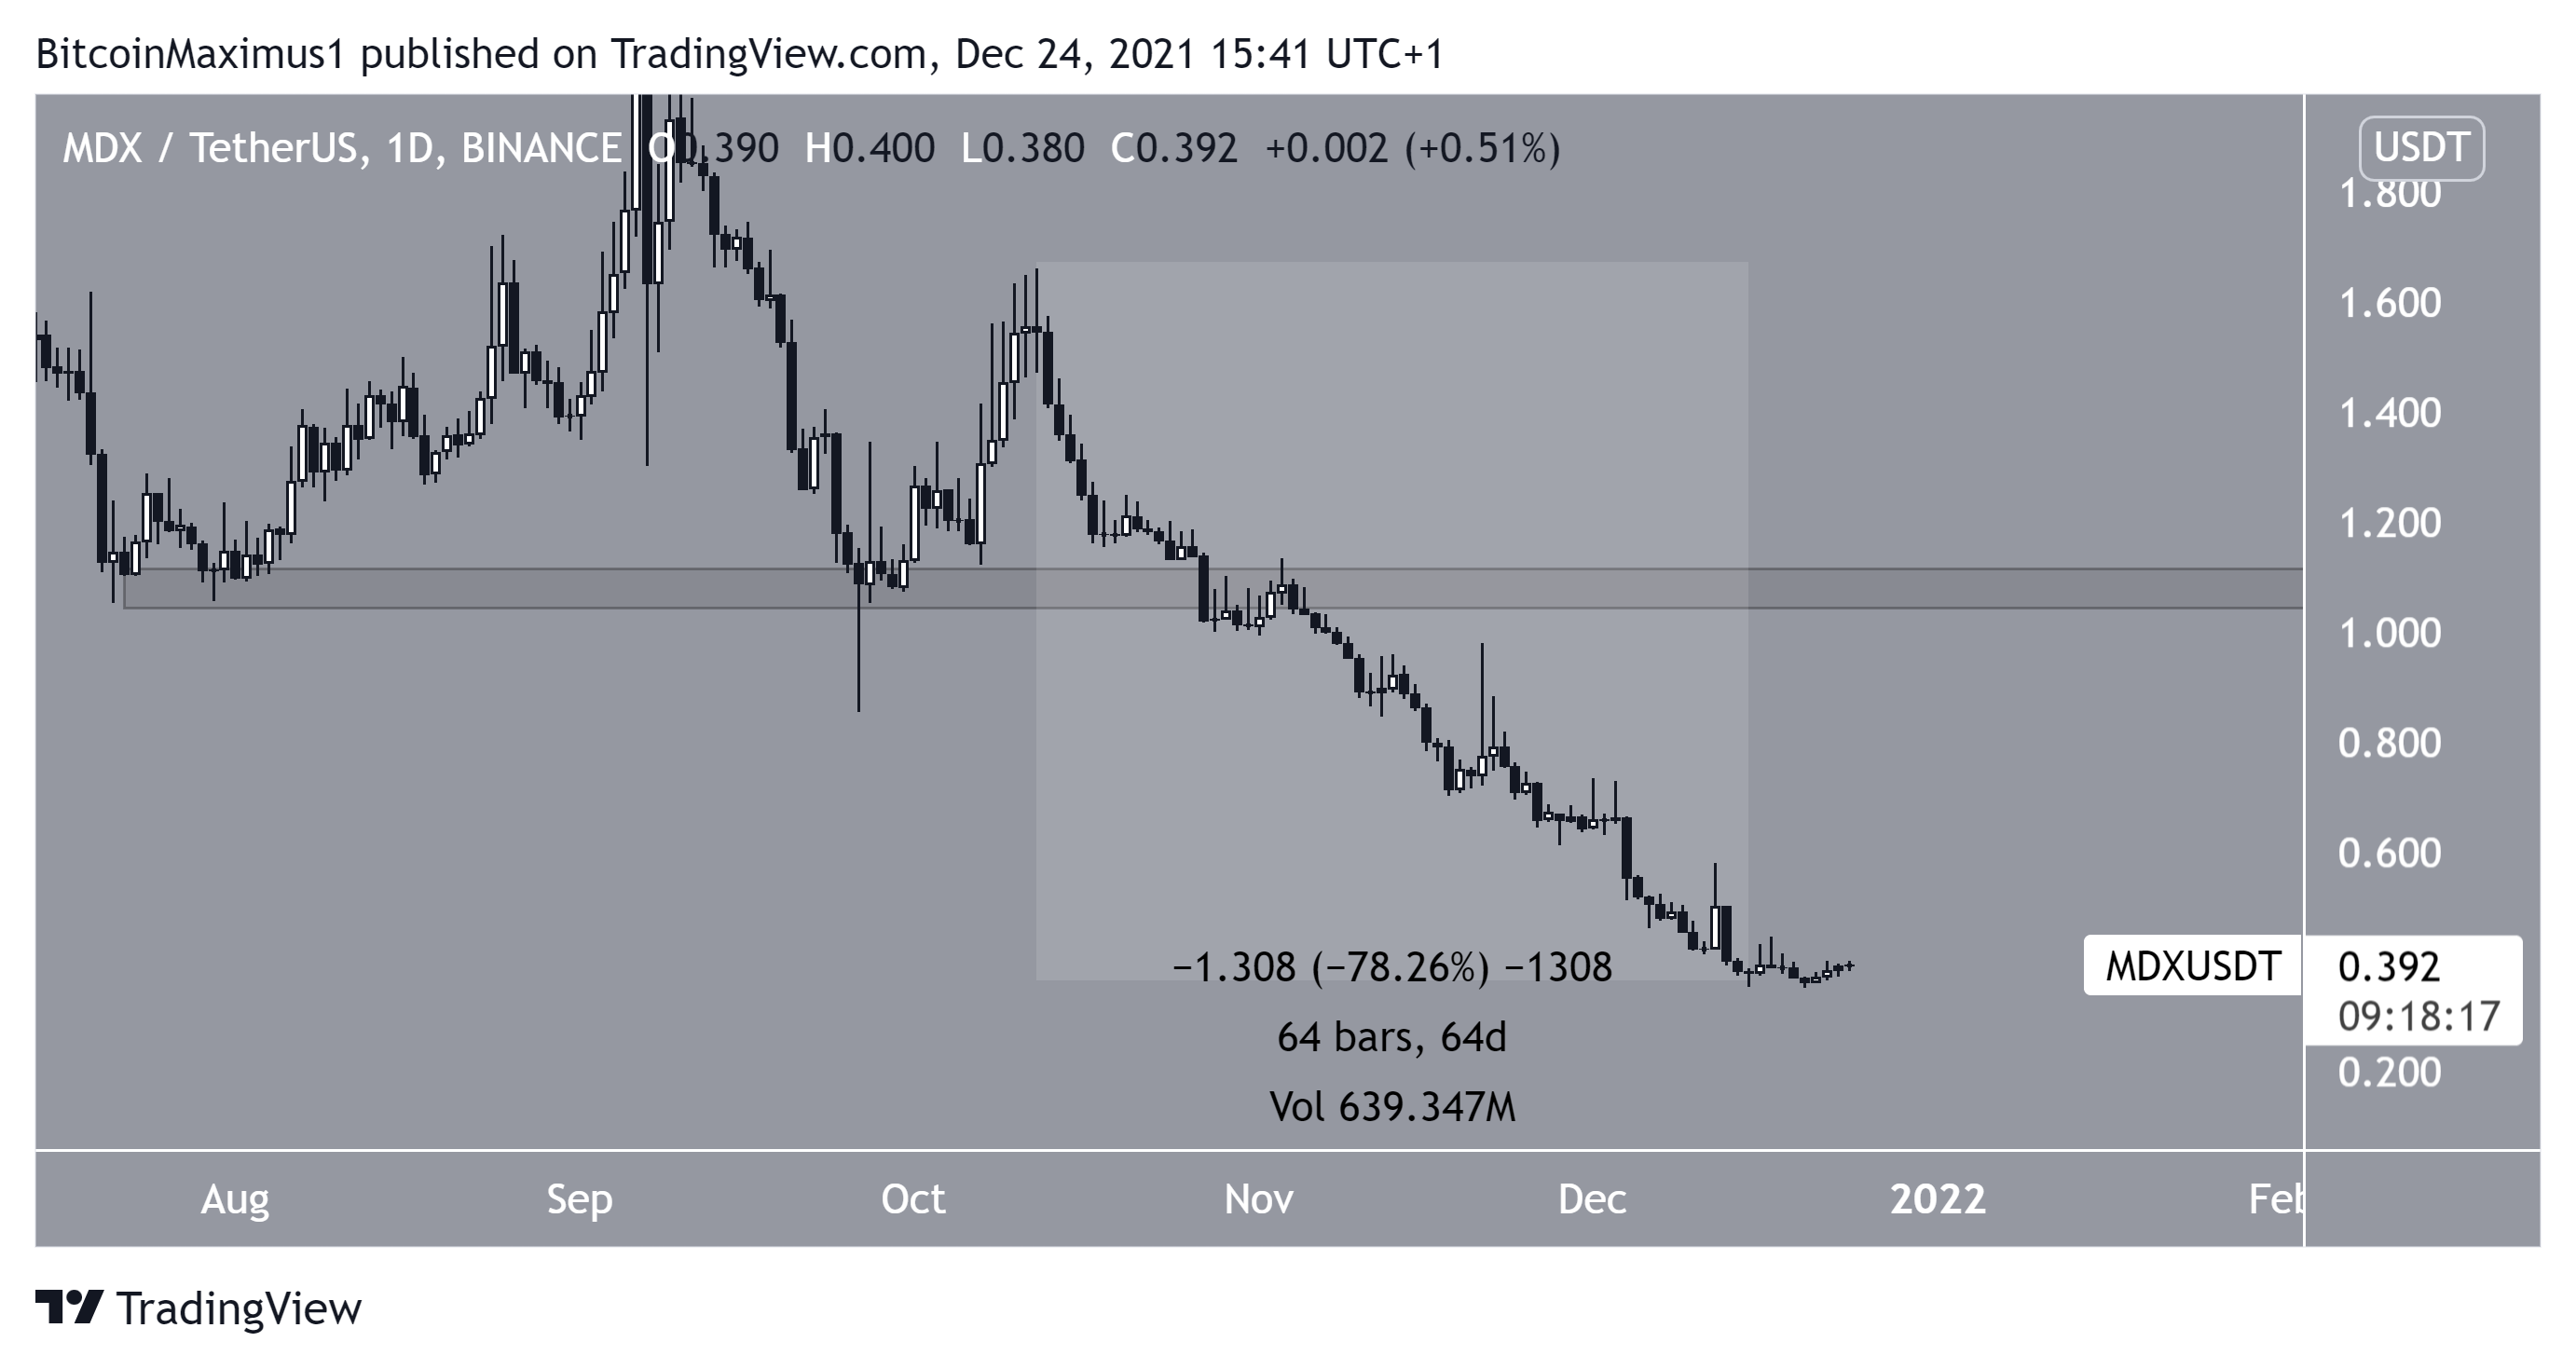
MDX has been falling since Oct 12. On Dec 15, it reached a new all-time low price of $0.34. This amounted to a 78% decrease in only 64 days.
Until MDX manages to reclaim the $1.90 area, which previously acted as support, the trend remains bearish.
VGX
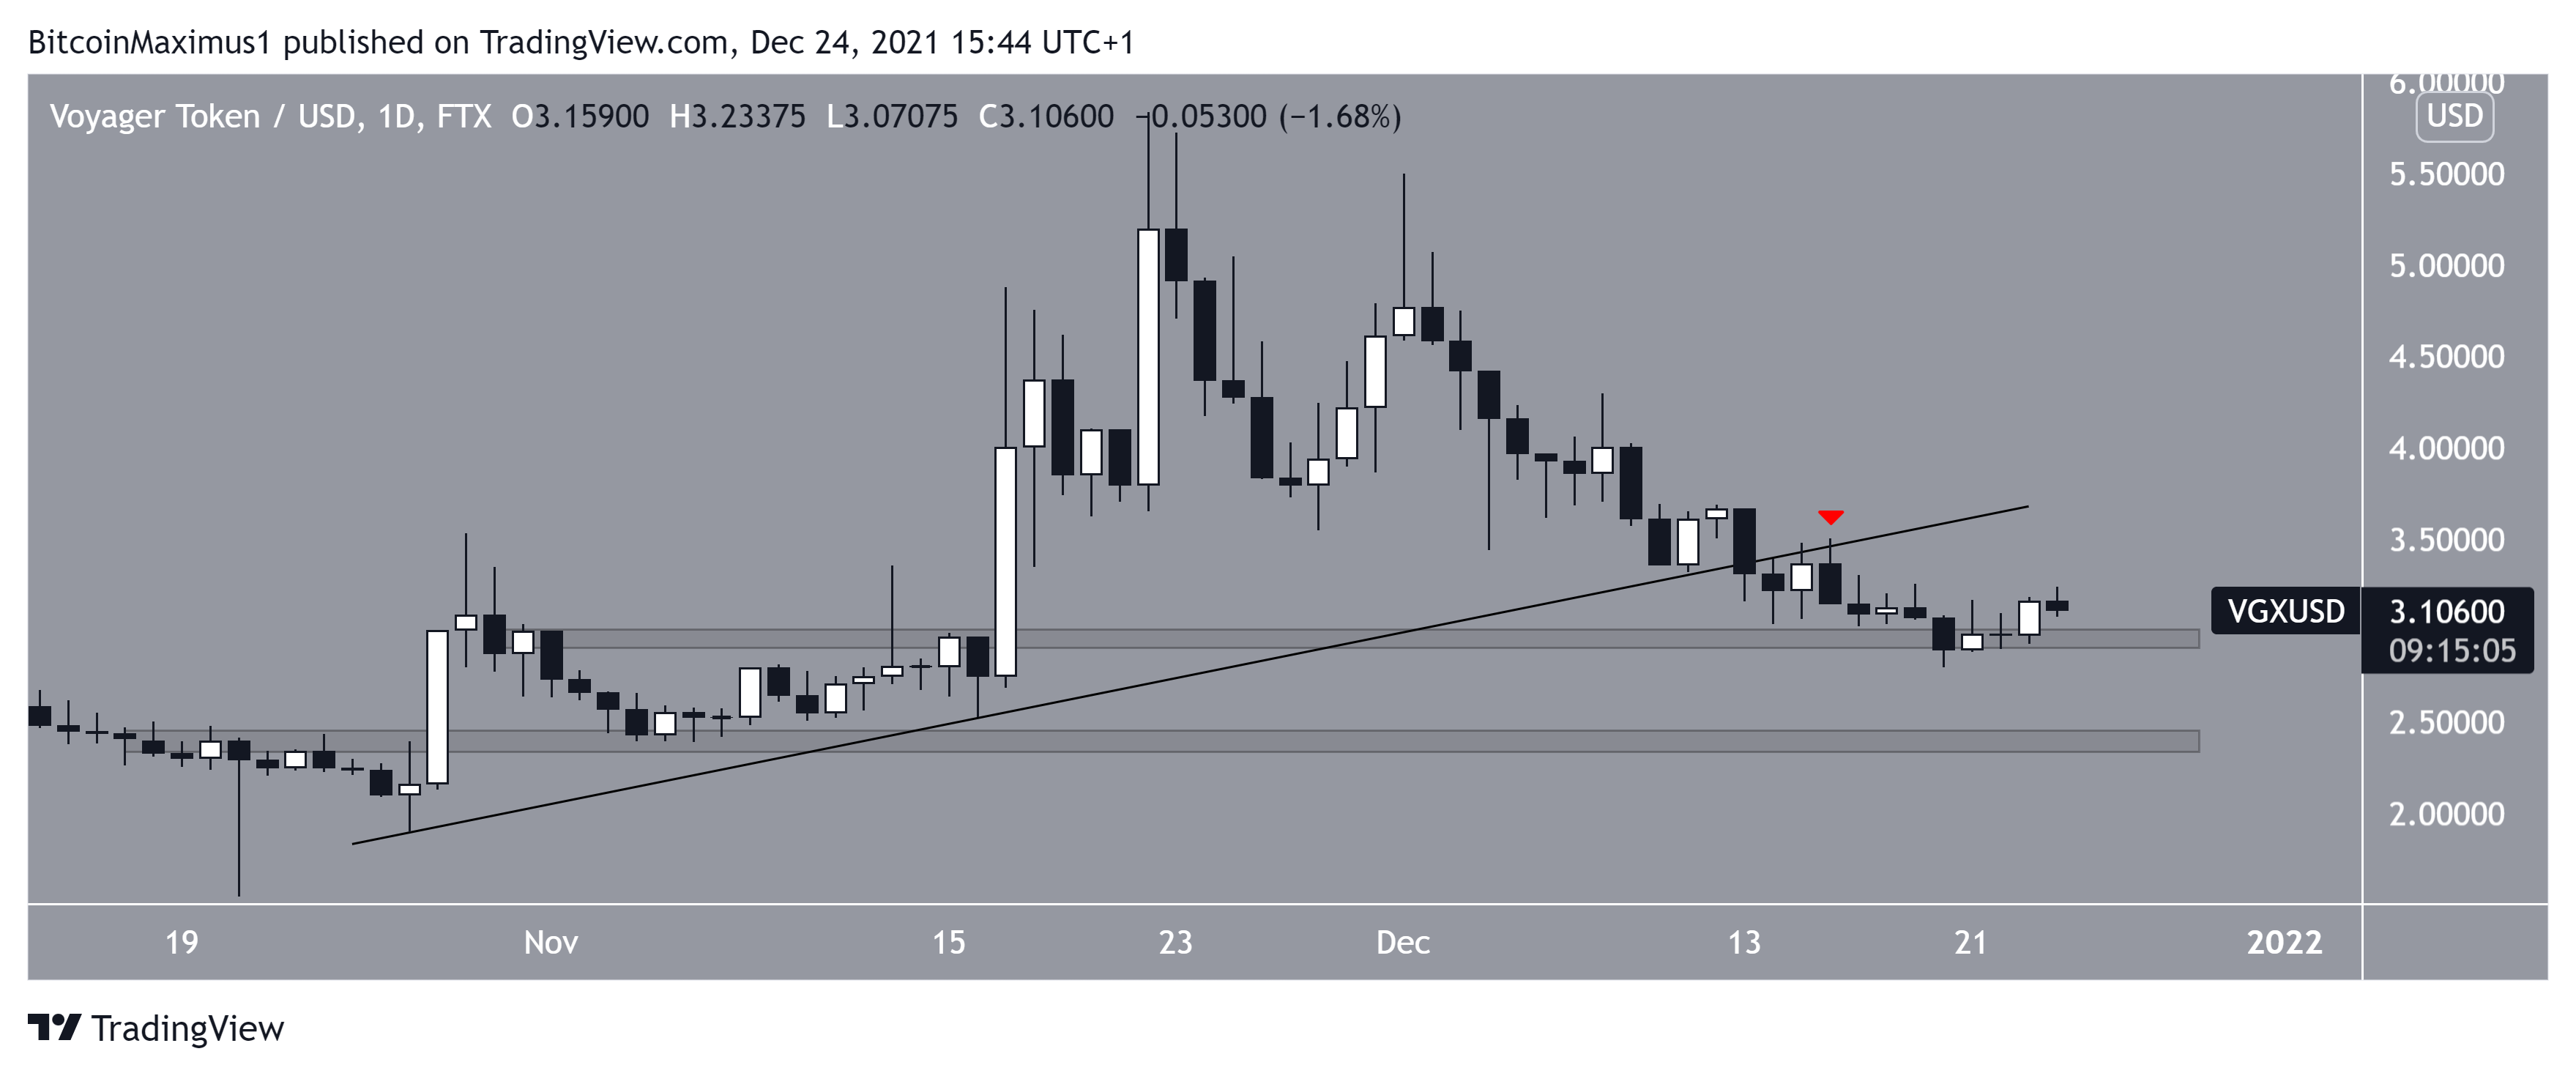
VGX has been decreasing since reaching an all-time high price on Nov 22. On Dec 14, it broke down from an ascending support line and validated it as resistance two days later.
Afterwards, the token managed to hold on above the $2.95 horizontal area. However, it has yet to initiate a significant upward movement.
If a breakdown from this area transpires, the next closest support would be at $2.40.
FX
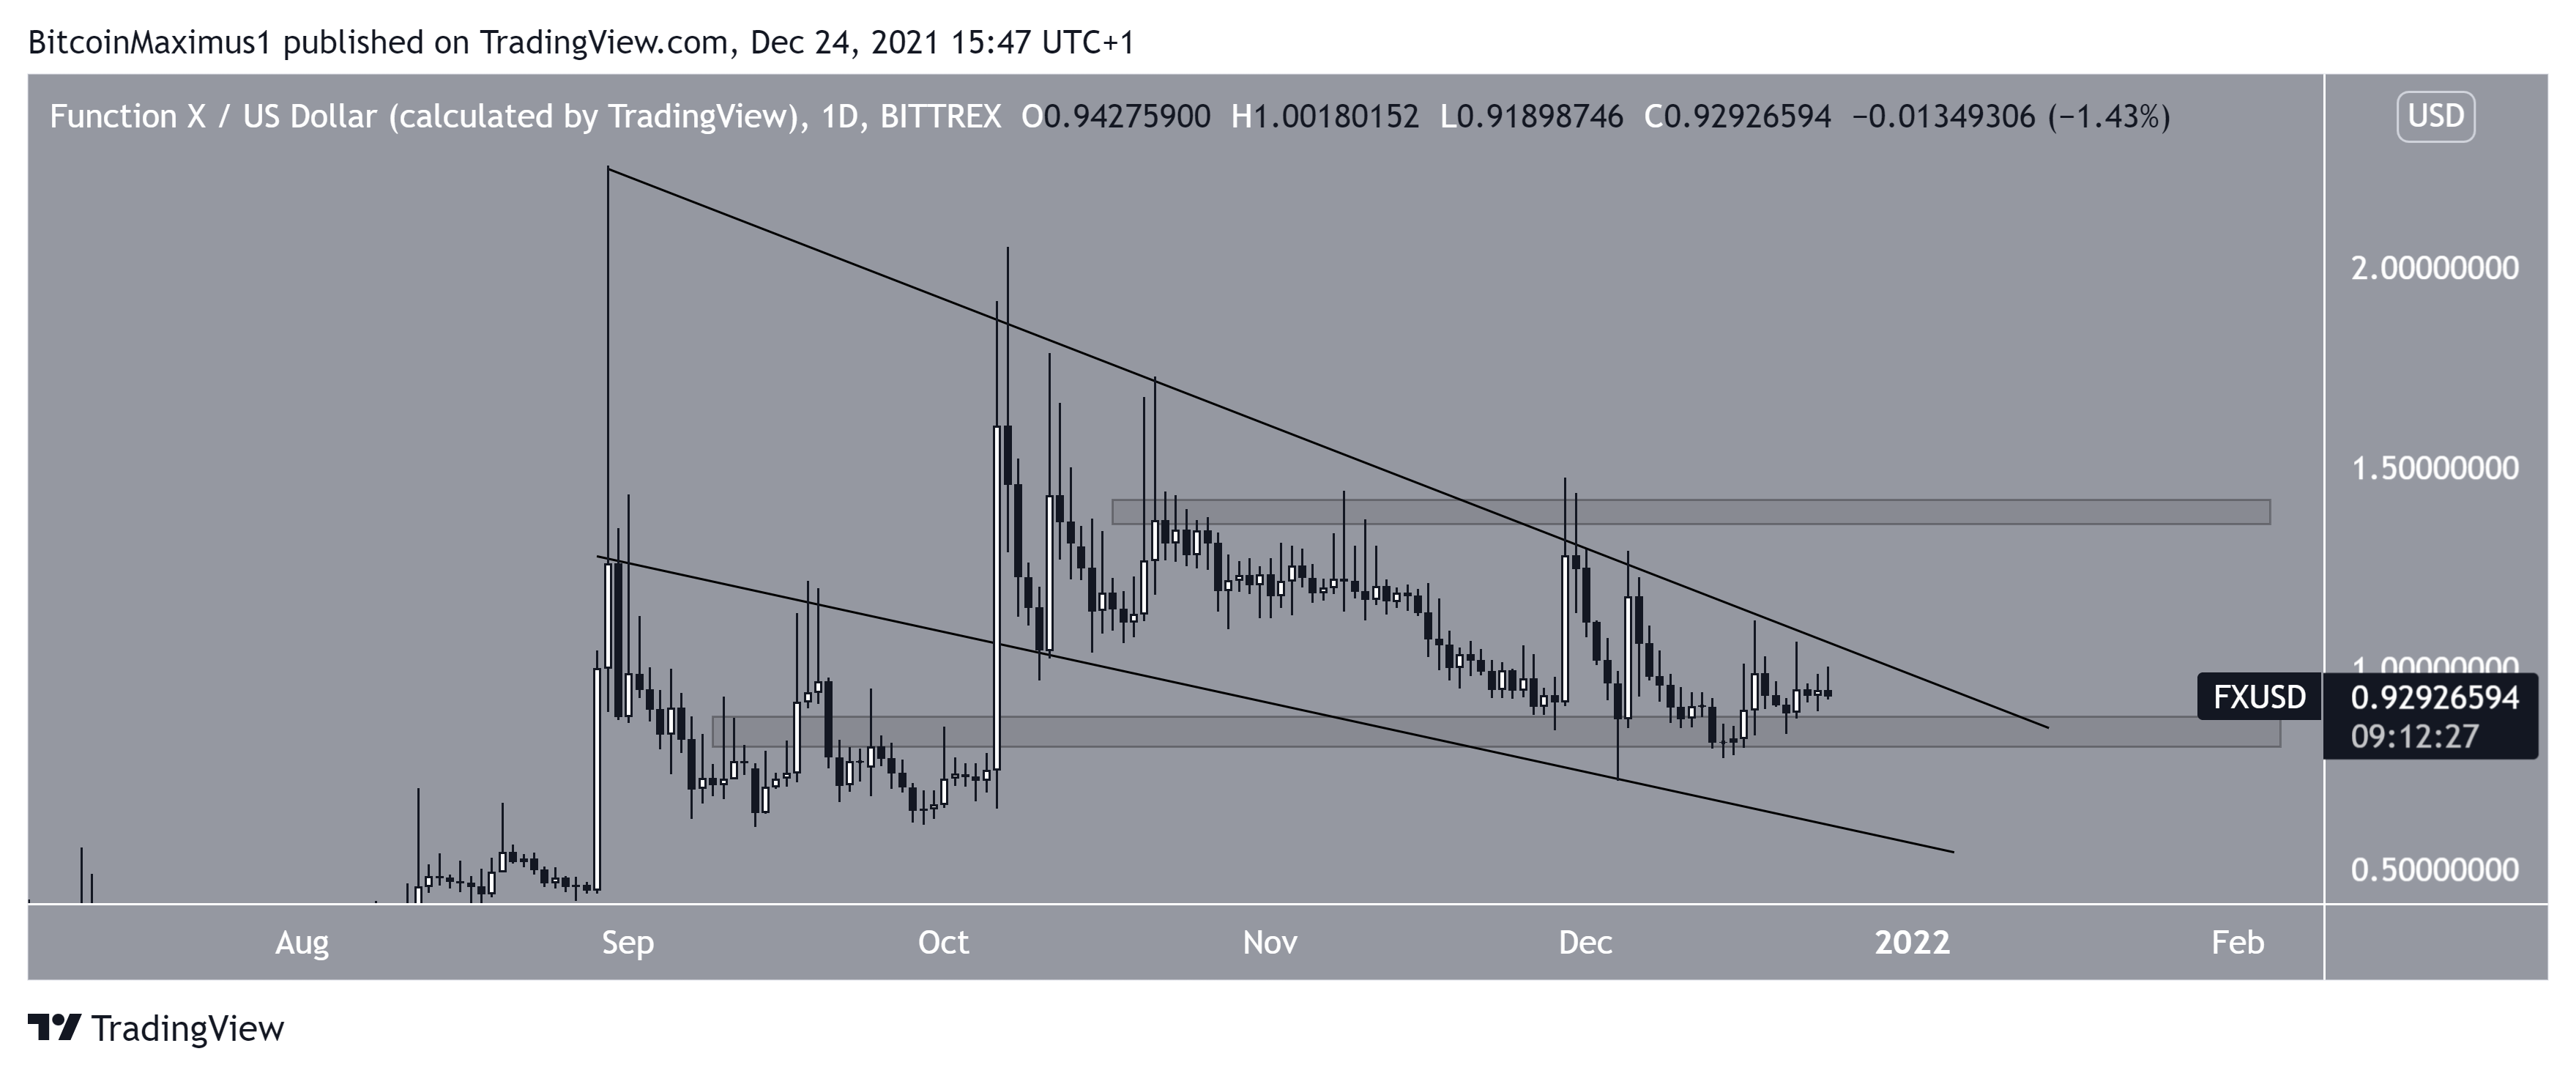
FX has been decreasing inside a descending wedge since Aug 30. While it reached a low of $ on Dec 4, it bounced afterwards and has been holding on above the $0.82 area.
Despite the lack of bullish reversal signs, FX is trading inside a bullish pattern, and holding on above horizontal support at $0.82.
If a breakout from the wedge transpires, the closest resistance would be at $1.40.
POLS
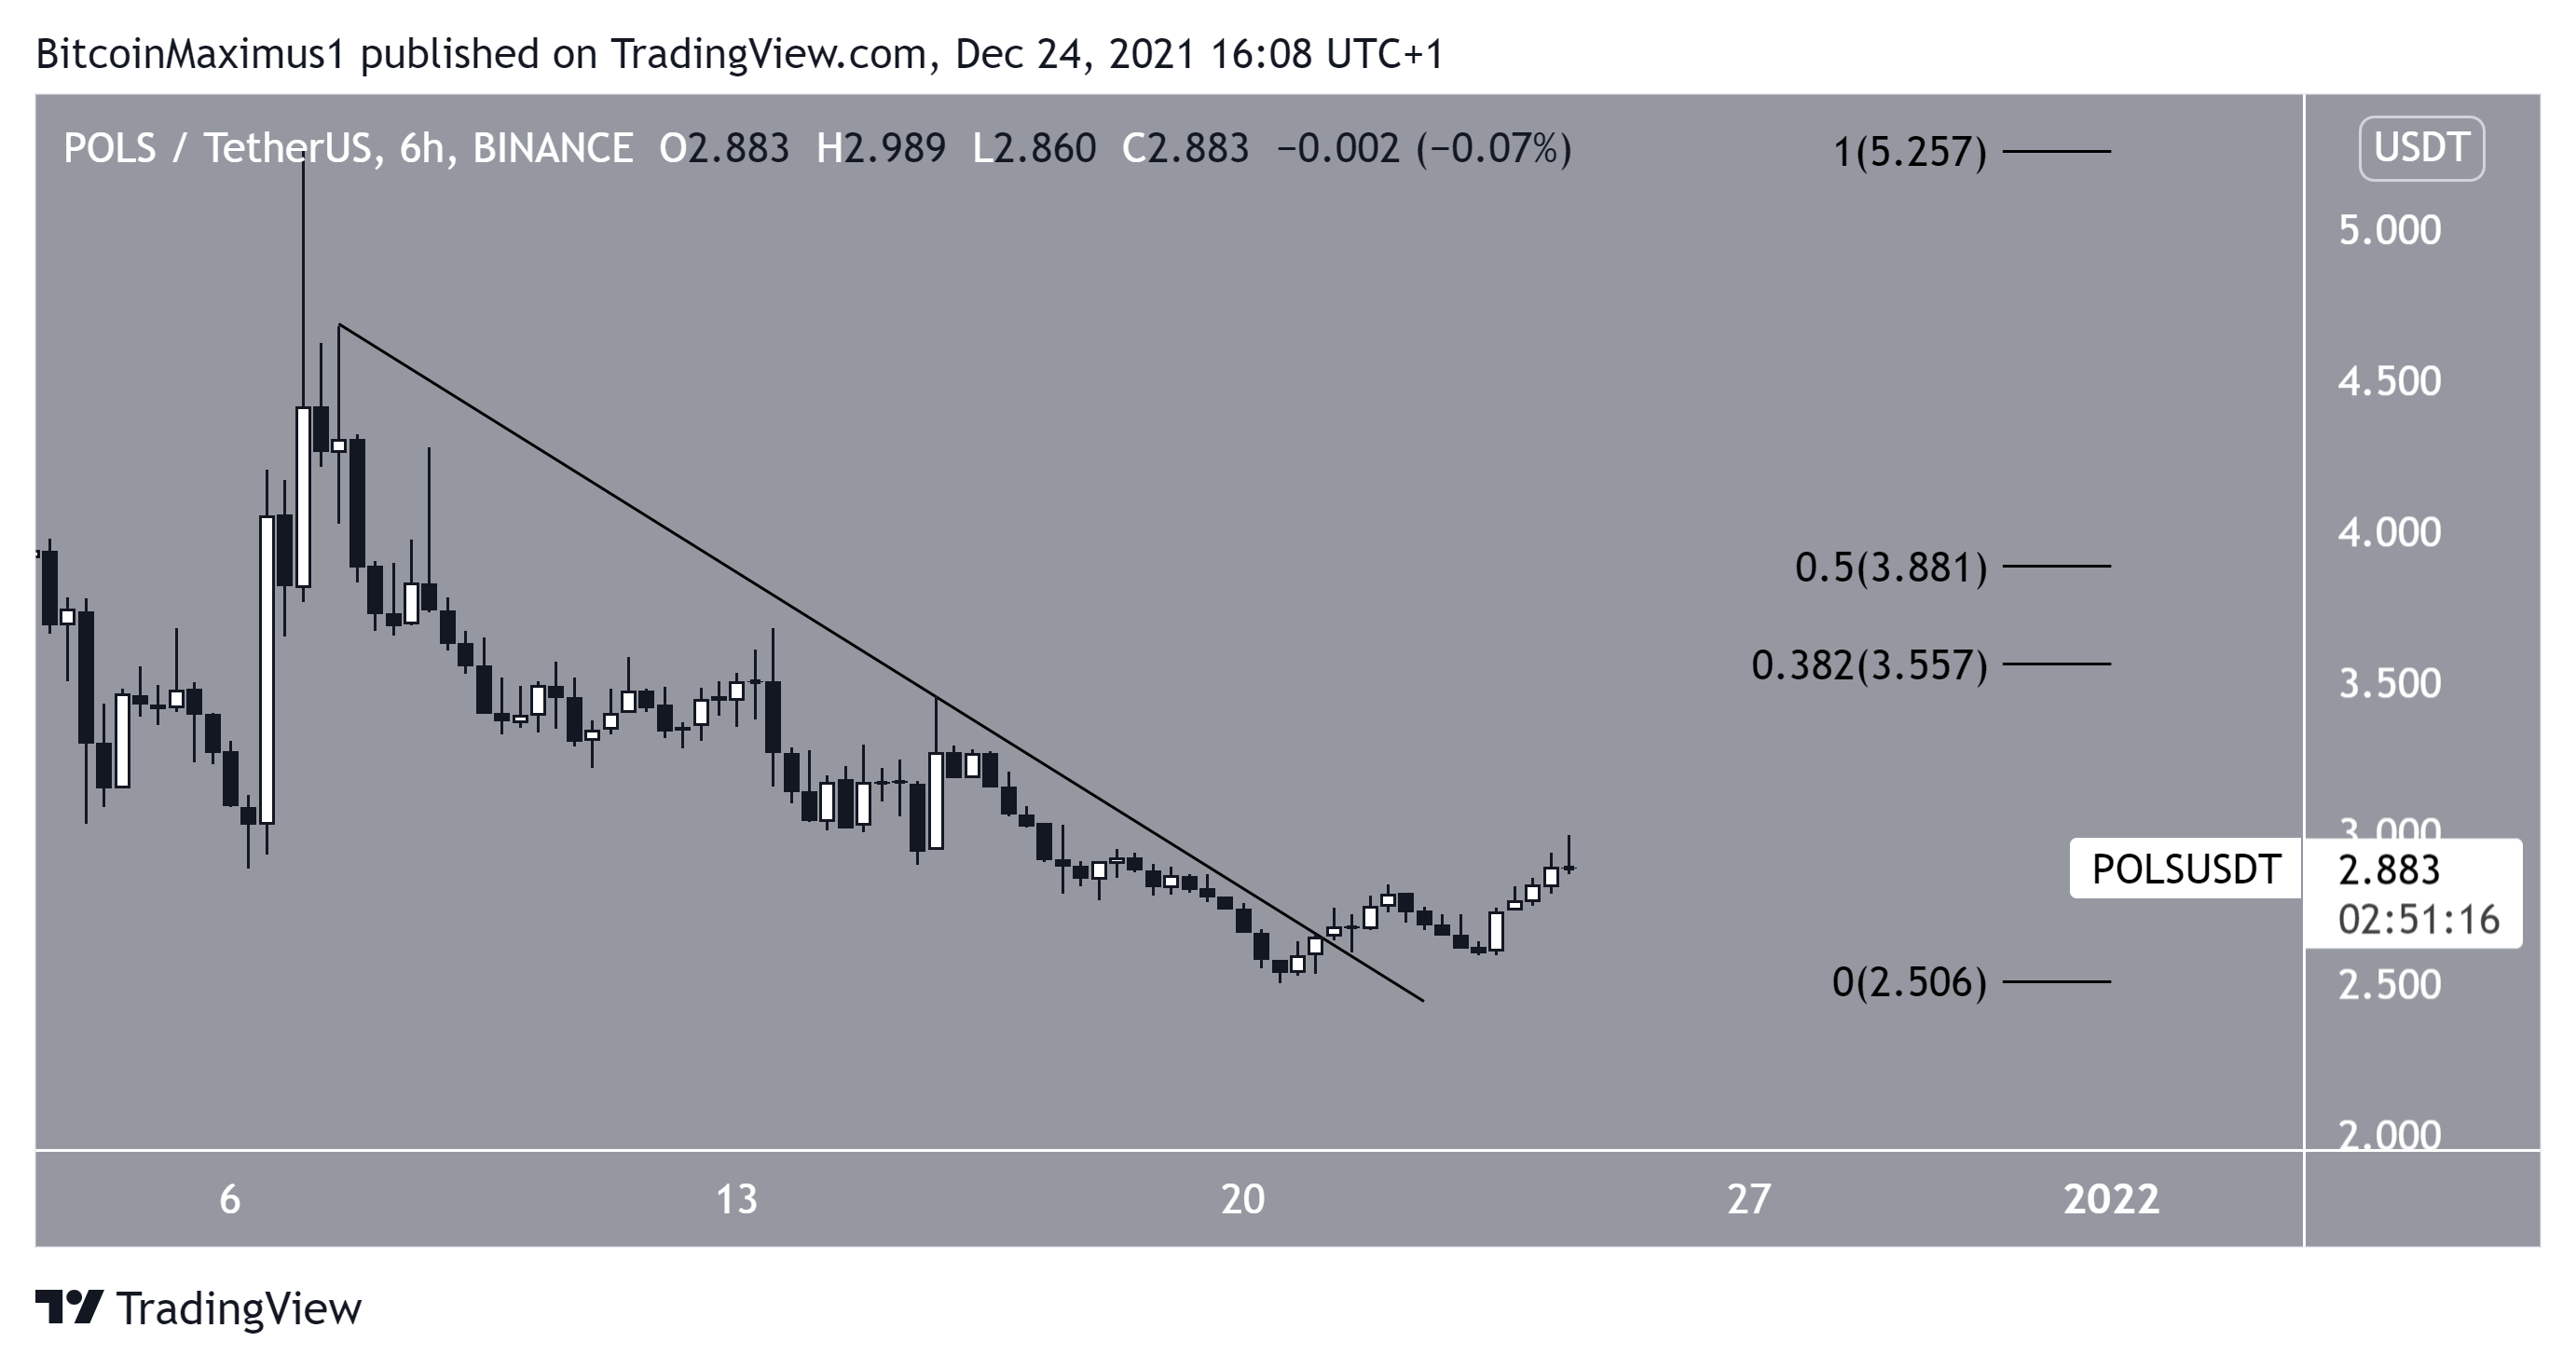
POLS had been decreasing alongside a descending resistance line since Dec 7. This led to a low of $2.5 on Dec 20.
Shortly afterwards, the token broke out from the resistance line and has been moving upwards since.
The main resistance is between $3.55 and $3.88, created by the 0.382-0.5 Fib retracement resistance levels.
CHSB
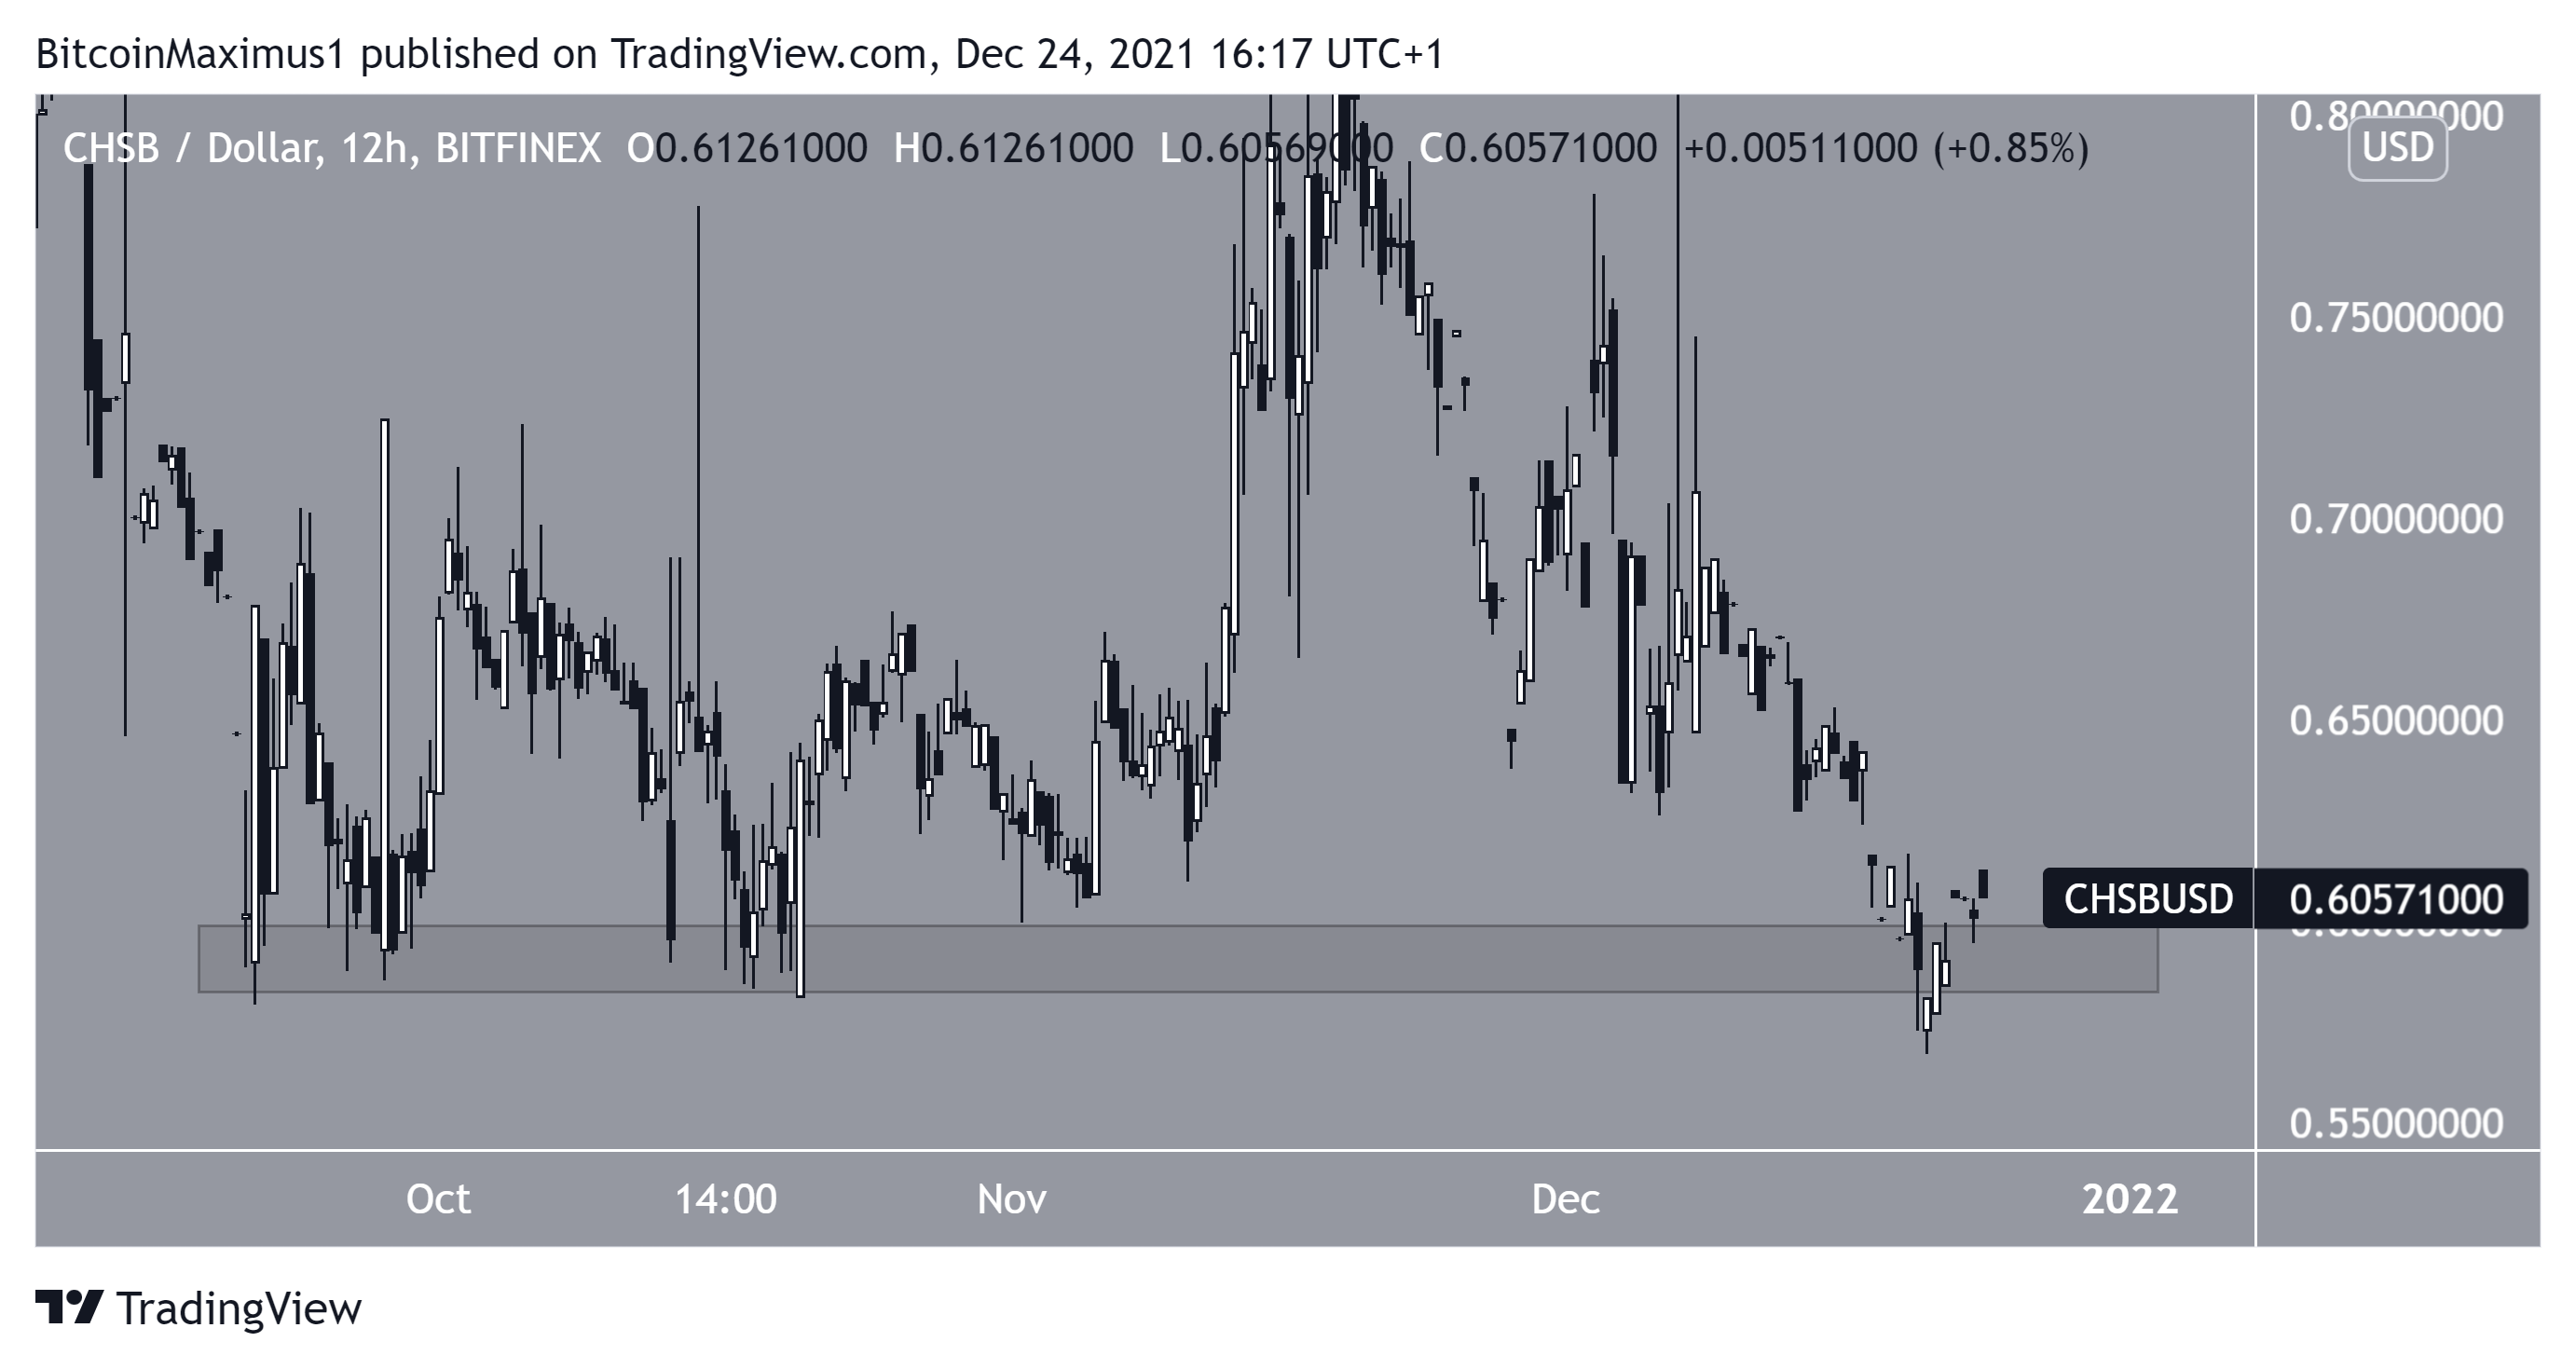
CHSB has been trading just above the $0.60 horizontal area since the beginning of Sept. On Dec 23, it initially broke down, but managed to reclaim the area shortly afterwards.
Whether it breaks down from it could determine the direction of the future trend.
For BeInCrypto’s latest Bitcoin (BTC) analysis, click here
Disclaimer
All the information contained on our website is published in good faith and for general information purposes only. Any action the reader takes upon the information found on our website is strictly at their own risk.

