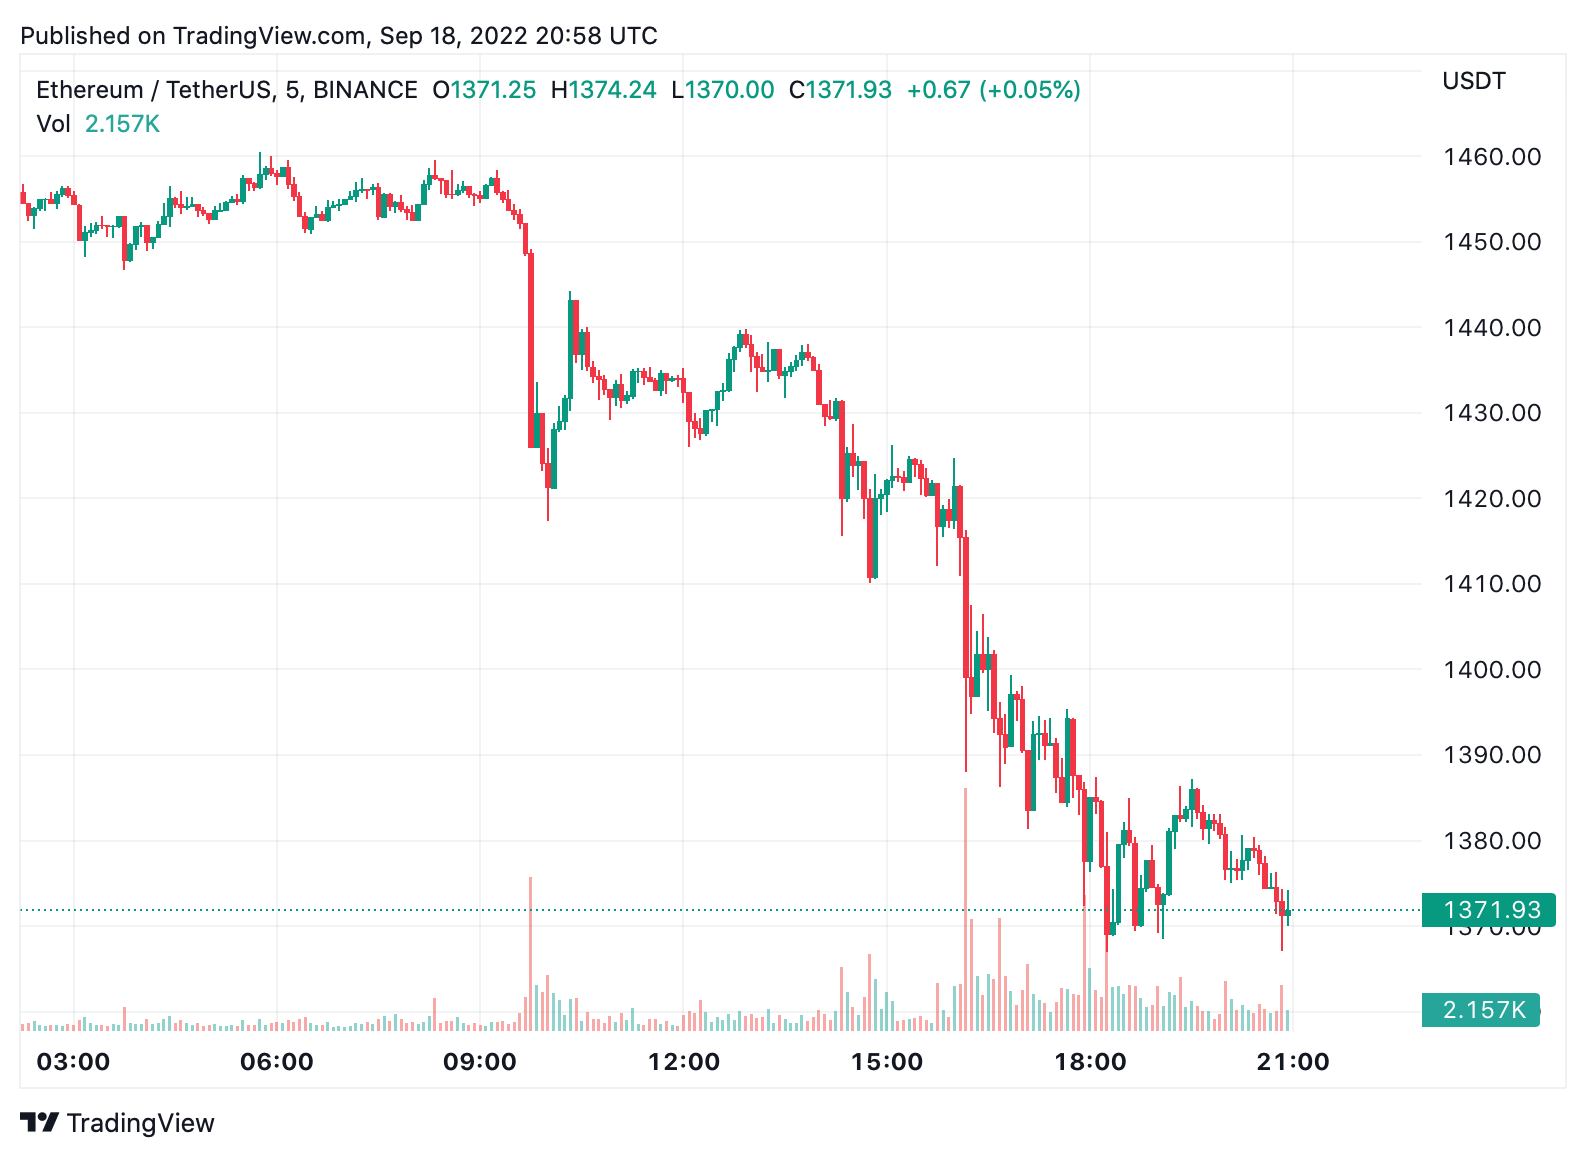
During the last 35 days, ethereum has lost a significant amount of market dominance leading up to The Merge. On August 14, 2022, the second leading crypto asset by market capitalization, ethereum, had a market dominance of around 19.5% but three days after the transition to proof-of-stake (PoS), it’s down 13% lower to 16.8%.
In 35 Days, Ethereum’s Market Dominance Slides 13% Lower
Ethereum’s market valuation has dropped a great deal during the past month after reaching $1,996 per unit on August 14, 2022. At that time, ethereum’s market cap was $239.74 billion, and ETH’s market dominance out of the $1.225 trillion crypto economy was roughly 19.5%. Bitcoin’s market dominance was approximately 38.2% at the time, and 35 days ago, BTC’s market valuation was around $470.79 billion.

While BTC’s market dominance has remained roughly the same, the crypto economy’s net value of $1.225 trillion back in August has plunged to today’s $994 billion. The crypto economy has lost 2.2% in USD value during the last 24 hours. Ethereum’s market dominance is now down to 16.8% after the second leading crypto asset’s market cap slipped from $239 billion to today’s $166.64 billion.

ETH has taken significant losses as 24-hour statistics show ether is down 5.8% on Sunday and 22.4% over the past seven days. While bitcoin (BTC) is down 1.4% on Sunday, BTC’s weekly stats indicate the leading crypto asset by market cap is down 9.1% against the U.S. dollar. During the past day, $58.13 billion in global swaps were executed across the entire crypto economy, and $12.17 billion or just over 20% of that volume has been ETH trades.
Ethereum has a broad spectrum of trading pairs with BUSD leading the pack capturing 35.10% of today’s ETH swaps. Tether (USDT) commands 33.34% of Sunday’s ethereum trades, and USD captures 9.78%. The greenback is followed by BTC swaps representing 4.45% of ETH pairs, JPY commands 2.33%, and the stablecoin USDC captures 2.23% of ETH’s trade volume. Binance and FTX are ETH’s most active trading platforms on September 18.
The Merge brought minimal gains to ethereum as year-to-date (YTD) statistics show ETH is down 59.6% and during the past 30 days, the second leading crypto asset by market cap lost 25.4%. During the past 24 hours on Sunday, ETH’s trading range has been between $1,471 per unit to $1,376 per unit. In addition to YTD data, ETH is down 71.7% since the $4,878 all-time price high printed ten months ago on November 10, 2021.
What do you think about ethereum’s market dominance sliding 13% during the last month? Let us know what you think about this subject in the comments section below.
Image Credits: Shutterstock, Pixabay, Wiki Commons
Disclaimer: This article is for informational purposes only. It is not a direct offer or solicitation of an offer to buy or sell, or a recommendation or endorsement of any products, services, or companies. Bitcoin.com does not provide investment, tax, legal, or accounting advice. Neither the company nor the author is responsible, directly or indirectly, for any damage or loss caused or alleged to be caused by or in connection with the use of or reliance on any content, goods or services mentioned in this article.
Read disclaimer


