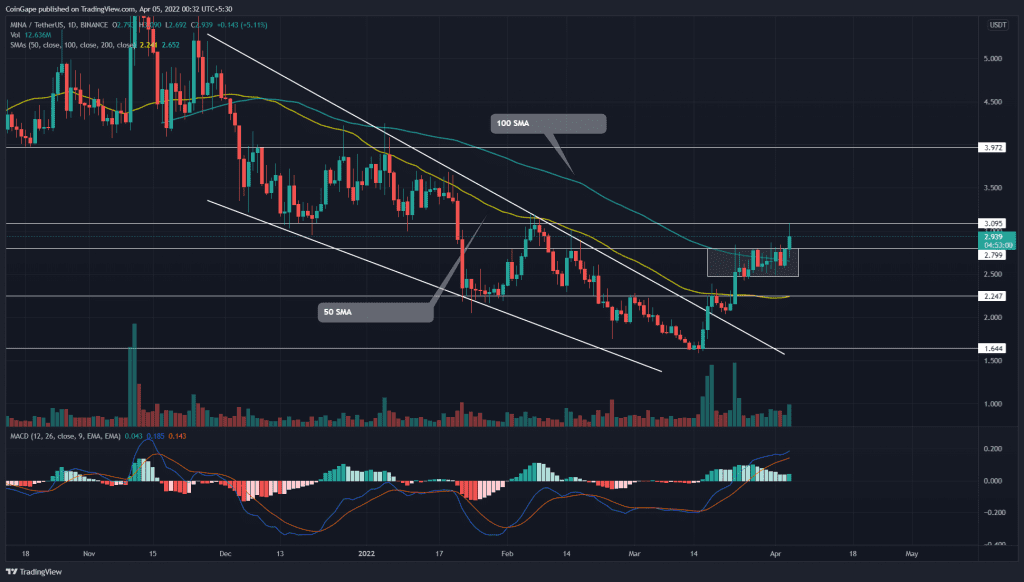
The MINA/USDT pair showcased a choppy price action wavering within the $2.8 and $2.47 mark during the last two weeks. Anyhow, the buyers managed to escape this consolidation with long bullish, hitting the $3 physiological level. However, the sudden selling pressure in the crypto market has formed a higher price rejection candle at this level.
Key Points:
- The MACD indicator near is a bearish crossover
- The potential reversal could descend the coin by 20%
- The 24-hour trading volume in the Mina coin is $243 Million, indicating a 203% gain
Source-Tradingview
A falling wedge pattern governed the last three months in the MINA/USD pair, bolstering traders to sell on lower high rallies. However, on March 17th, the buyers gave a bullish breakout from the descending trendline of the price pattern, indicating a positive turn in traders’ sentiment.
The post-retest rally drove the altcoin by $38%, reaching the $2.8 mark. However, amidst the uncertainty in the crypto market, the MINA price fluctuated in a narrow range for the last two weeks.
Anyhow, the buyers took the initiative and breached the mentioned resistance with a long bullish candle. The coin price retested $3 resistance earlier today, teasing a follow-up breakout. However, a long-wick rejection attached to the daily candle suggests weakness to the bullish momentum.
However, if bears sustain the MINA price below the $3 resistance, the selling pressure would eventually rise and pull the price back to $2.2 support.
Alternatively, a bullish breakout from $3 resistance would continue the bull run to the $4 mark.
Technical Indicator
The 50-and-100-day SMA moving flat suggests a sideways rally for the Mina coin. However, the coin price trading above these SMAs bolsters the recovery rally.
The MACD indicator shows that the fast and slow lines moving close could trigger a bearish crossover anytime. This bearish signal may encourage additional aselling among traders.
- Resistance levels– $3 and $4
- Support levels– $2.8 and $2.45


