Disclaimer: The findings of the following analysis are the sole opinions of the writer and should not be considered investment advice.
- A divergence between OBV and price suggests a bullish reversal
- Price action remained bearish on higher timeframes
Monero [XMR] has been on a higher timeframe downtrend since late April. Since then, the price has not managed to break out above its previous lower highs. Above XMR lay formidable resistance zones at $150, $180, and $208.
Here’s AMBCrypto’s Price Prediction for Monero [XMR] in 2022
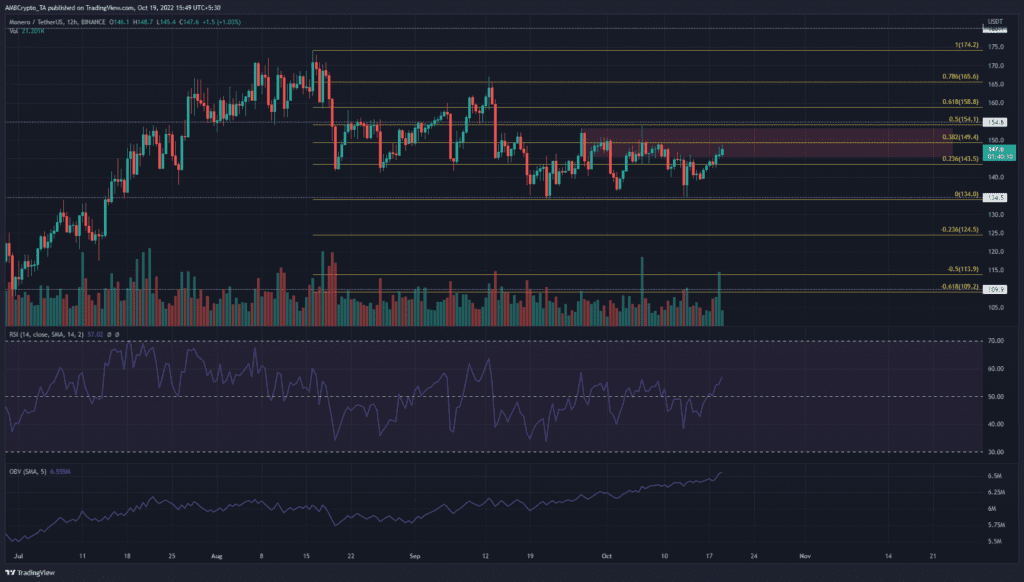
A previous article noted how $150 was a firm resistance. The lower timeframe range highs at $153 saw the bears hold their own and forced a sharp decline back to the $135 support area.
Bearish order block beneath the 50% retracement level
A set of Fibonacci retracement levels (yellow) were drawn based on XMR’s move from $174.3 down to $134. The 50% retracement level was at $154.1, which was close to the psychological $150 level. Moreover, the $154.8 level has also been a significant level in recent months.
In early September, XMR broke down beneath the $143 support and flipped the market structure to bearish. Its rally later that month to the $152.8 area only served to establish a bearish order block. Demarcated by the red box, this area can be used by traders to sell XMR.
Until the bulls manage to drive prices past $155, the structure and bias on the 12-hour chart would remain bearish. The Relative Strength Index (RSI) has been below neutral 50 for a good portion of the past month too, although at press time it made an attempt to climb past 60.
Surprisingly, the On-Balance Volume (OBV) has been in an uptrend over the past month. This contradicted the bearish notion laid out previously, and suggested that buyers have accumulated Monero in recent weeks. This could see a breakout to the north in the next few months.
Funding Rate negative once more as futures traders turn bearish

Source: Santiment
The weighted sentiment metric has been negative for XMR since mid-August. After the rally to $174, the weighted sentiment was unable to climb into positive territory and stay there for any significant period of time. Combined with the downtrend on the price charts, the indication was a distinct lack of faith in bullish price action for the asset in recent weeks.
The funding rate has also gone on a negative trajectory in recent weeks. This showed that shorts were more popular among futures traders, and with good reason. Therefore, the metrics also supported a bearish bias behind XMR in the coming days.
The rising buying volume on the OBV despite its trend was the only factor that credibly indicated a move past $150 was brewing. Meanwhile, the price action showed $150-$154 to be a crucial resistance zone.


