NANO is showing signs of strength by bouncing at a long-term support area and breaking out from a descending resistance line afterwards.
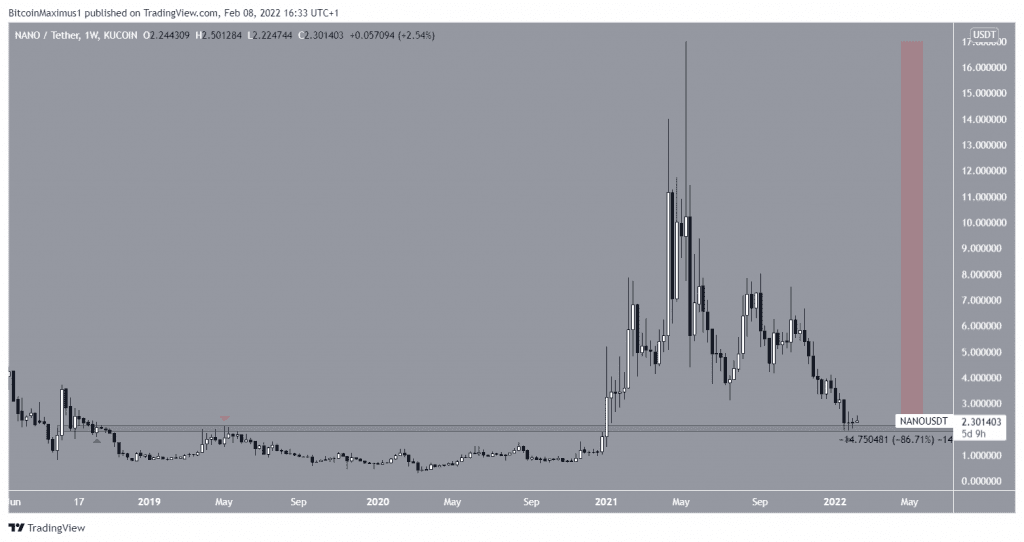
NANO has been falling since reaching an all-time high price of $17 on May 13. The downward movement has led to a low of $1.91 on Jan 24 (green icon).
The low served to validate the $2 area as support. The area acted as resistance in May 2019 and has now seemingly turned to support once more.
Measuring from the all-time high, NANO has decreased by 86.71%.
Ongoing NANO breakout
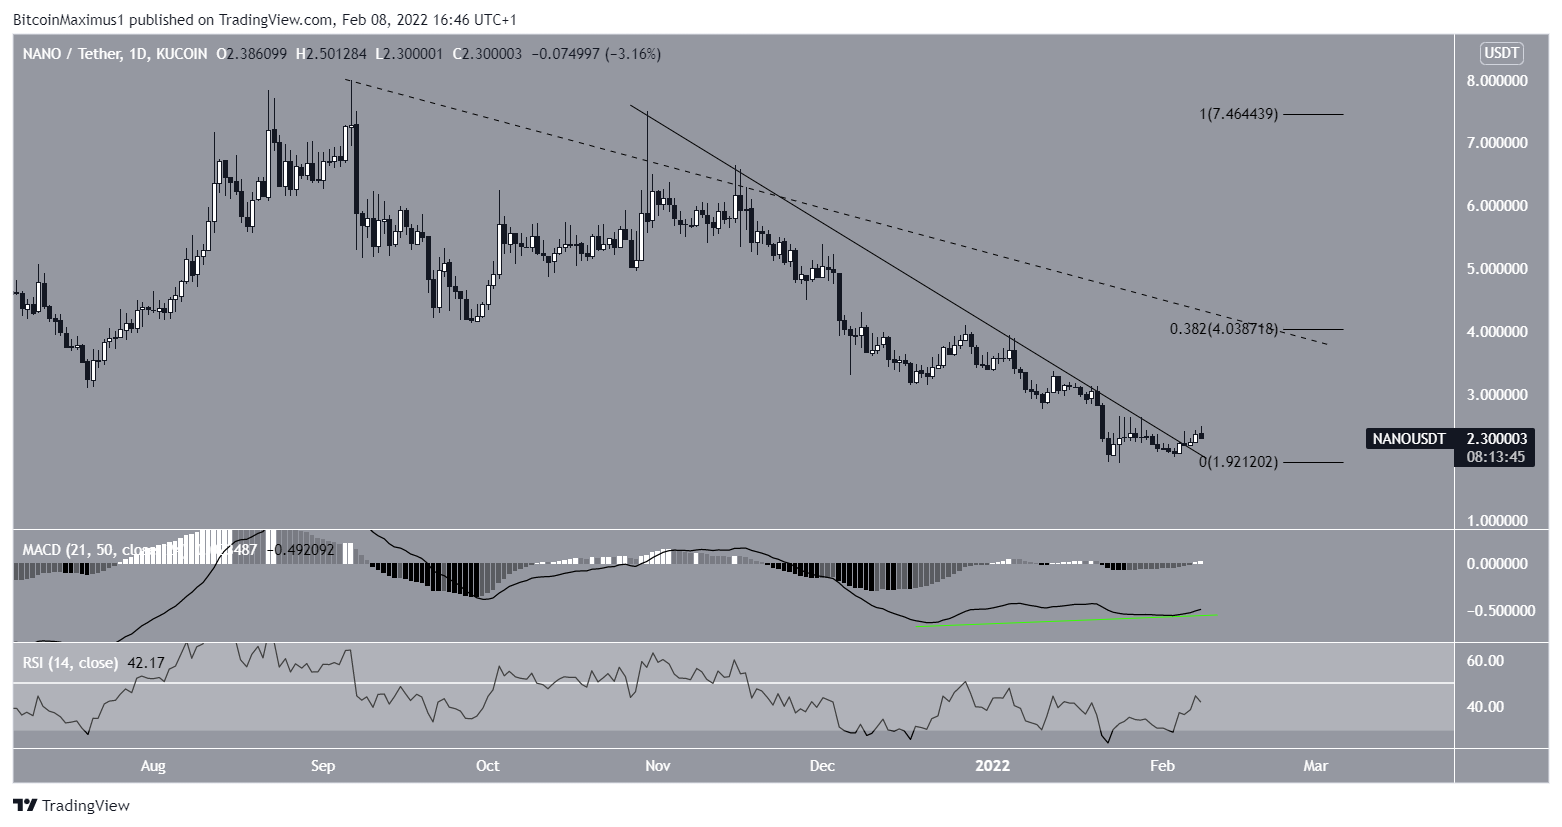
The daily chart is showing several signs of strength.
Firstly, there is a very significant bullish divergence that has developed in the MACD. Such occurrences are often followed by bullish trend reversals.
Secondly, NANO has broken out from a descending resistance line, which had previously been in place since Oct 30.
The main resistance area is at $4. It is created by the 0.382 Fib retracement resistance level and coincides with another descending resistance line (dashed), which has been in place since Sept 6.
Wave count analysis
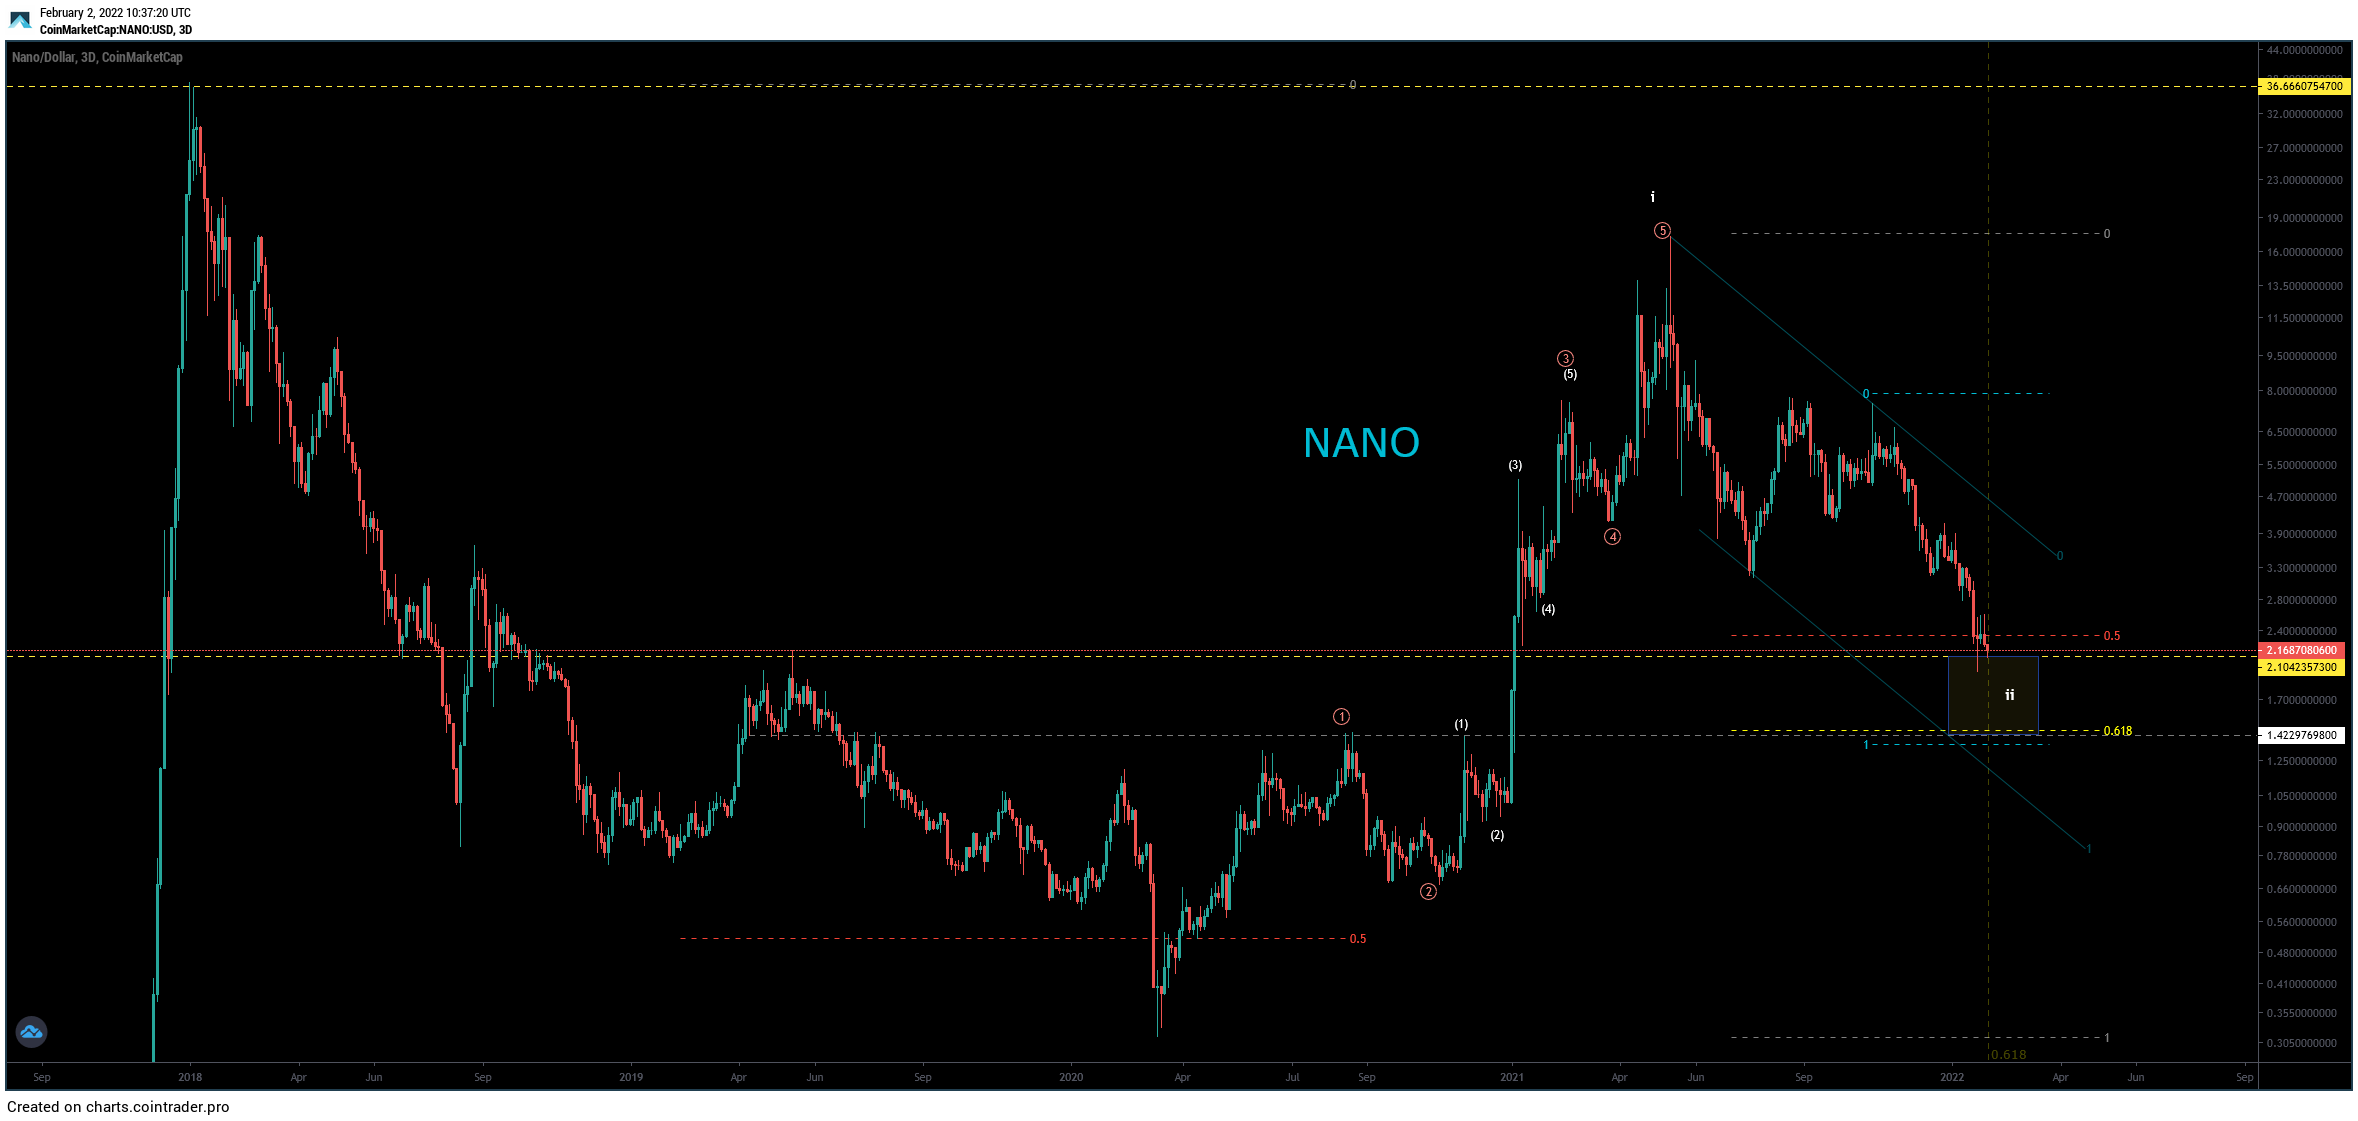
Cryptocurrency trader @ewfib tweeted a chart of NANO, stating that the token might have completed its correction.
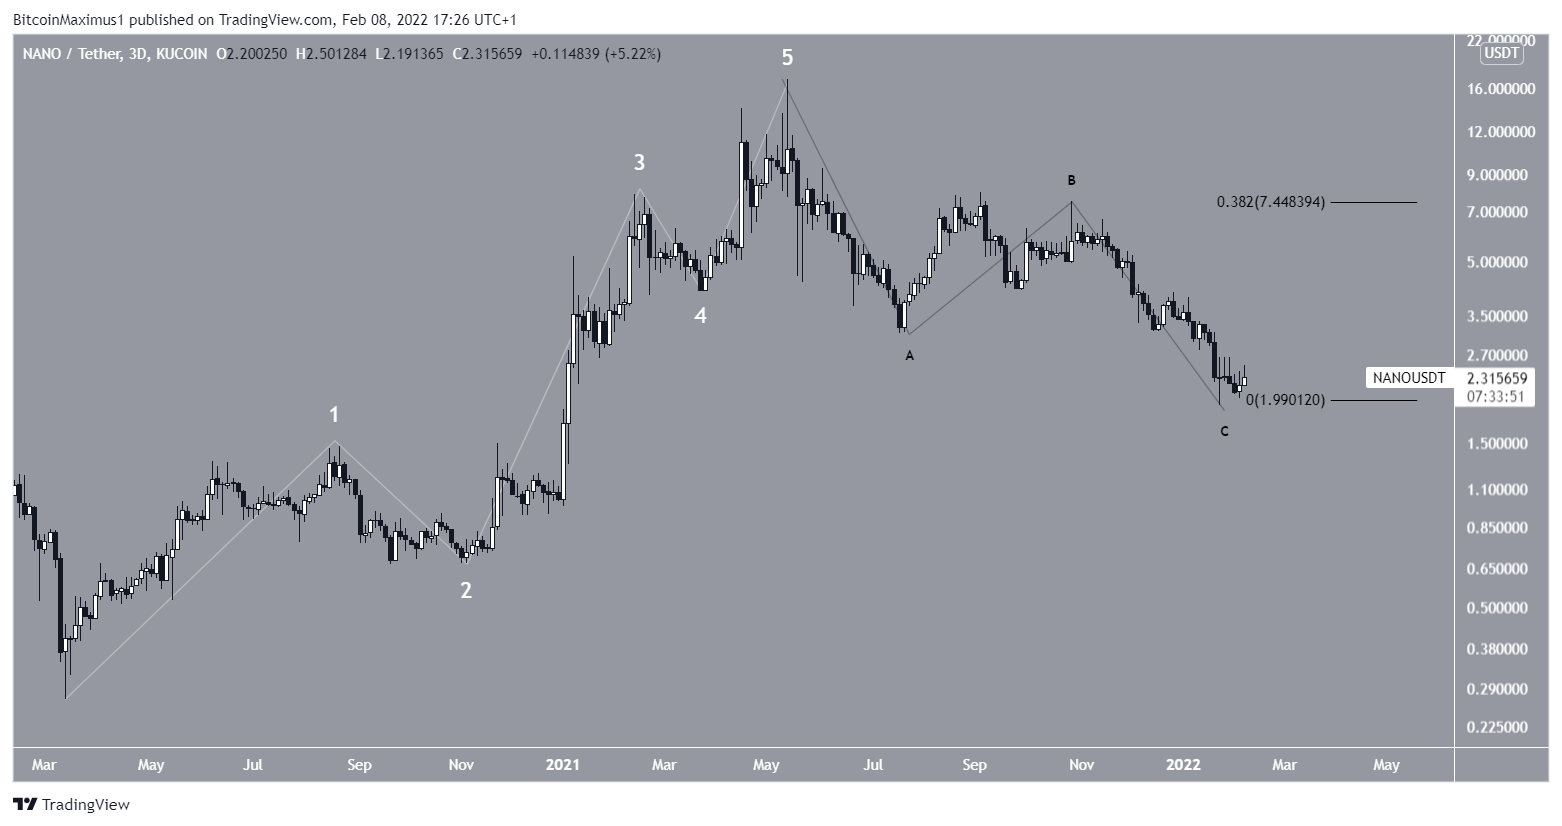
Measuring from the March 2020 low, it does seem that NANO has completed a five wave upward movement (white), which led to the all-time high price.
Since then, the price has been correcting in what looks like an A-B-C corrective structure.
However, wave C is only 0.382 times the length of wave A, which is unusually short. However, it is possible that the reason for this is the long upper wick, which reached the all-time high.
Nevertheless, the extremely short length of wave C makes it possible that the correction is not yet complete. This also fits with the price action, since NANO has yet to break out from its second descending resistance line or the $4 resistance area.
Therefore, until it is successful in doing so, the correction cannot yet be considered complete.
For BeInCrypto’s latest Bitcoin (BTC) analysis, click here
Disclaimer
All the information contained on our website is published in good faith and for general information purposes only. Any action the reader takes upon the information found on our website is strictly at their own risk.


