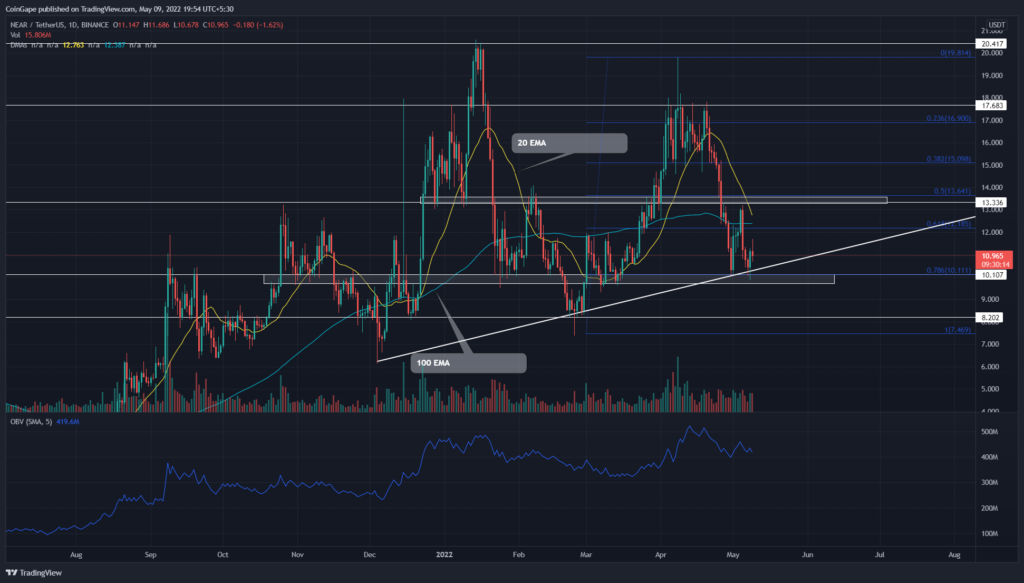
While most cryptocurrencies have been negative in the past 24 hours, the Near Protocol is one of the few coins that is trading in green. The altcoin was 3% high during the early hours and retested the $11.5 mark. Furthermore, the double bottom formation should pump the NEAR price above the $13.2 mark.
Key points:
- The NEAR chart hints potential bearish crossover between 20 and 100 DMA
- A bullish divergence in the OBV chart bolsters a bullish reversal from the $10 support
- The intraday trading volume in the NEAR is $1.37 Billion, indicating a 103.5% hike.
Source- Tradingview
In late April, the Near Protocol(NEAR) correction tumbled the coin price by 42% lower to $10. However, the altcoin met a confluence of technical support at this mark which mounted a strong defense for buyers.
These support levels consist of a long-coming ascending trendline, 0.786 Fibonacci retracement level, and the $10 psychological level. The NEAR price has rebounded from this support twice within a week, indicating strong interest from buyers.
Moreover, the coin chart shows double bottom pattern formation in the daily time frame chart. The NEAR price currently trades at the $11.03 mark, and responding to the bullish pattern; it should rise to the $13.5 neckline.
Trending Stories
A bullish breakout from this resistance would bring additional buying to the market and drive the coin price to $15.
advertisement
On a contrary note, the $10 fallout would accelerate the ongoing correction to $8.2 support.
Technical indicator
The flattish 100 DMA illustrates an overall range rally in NEAR price. However, the 20 and 100 DMA nearing a negative crossover could accelerate the selling pressure.
The trending OBV indicator determines the growing interest of crypto traders. This bullish divergence would encourage the double bottom breakout from $13.5
- Resistance levels- $13.5, and $15.1
- Support levels-$, $10 and $8.2


