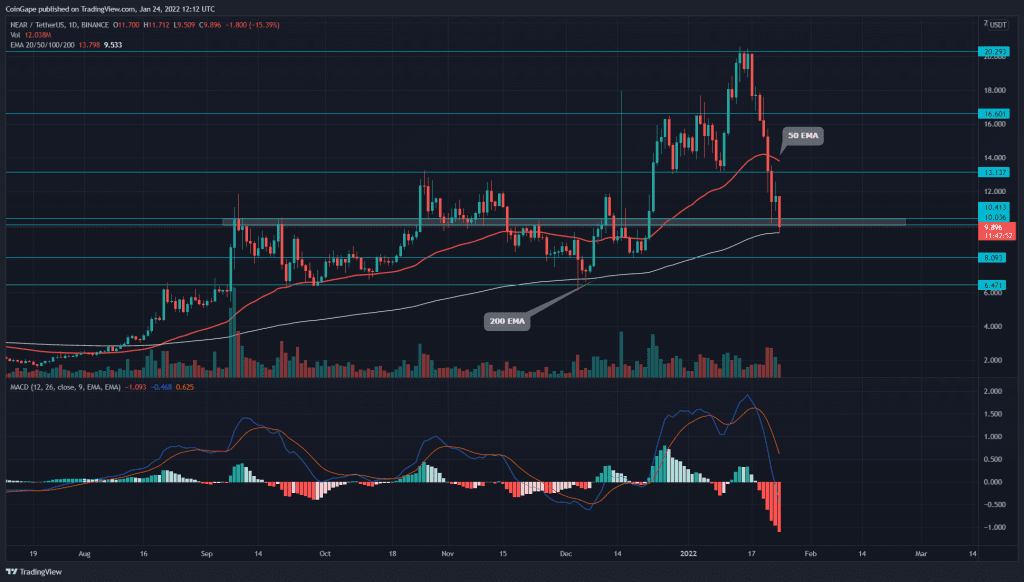
The NEAR price tumbled over 50% from the All-Time High of $20.42. The NEAR/USD pair has lost two critical support of $16 and $13 along the way, and now the sellers aim to knock out the $10 mark. Check out the complete article to know how far will this correction go.
Key technical points:
- The NEAR price retest the 200-day EMA line
- The daily-MACD indicator lines are entering the bearish territory
- The intraday trading volume in the NEAR coin is $929.3 Million, indicating a 0.81% fall.
Source- Tradingview
In our previous coverage of Near Protocol technical analysis, NEAR rally was riding its new year rally which made a new ATH at $20.4. However, the intense sell-off in the crypto market triggered a bearish reversal and plunged the price to $10 support.
The NEAR price lost around half its value in this downfall and is still struggling to sustain above the $10 mark. If sellers could drop this coin below this bottom support, the crypto traders could see a free fall to the $8 mark(-20%)
Under the influence of bearish sentiment, the Moving average convergence divergence shows the MACD and signal are prepared to slink below the neutral zone(0.00). Moreover, the constant rising red bar in the histogram chart displays the strong selling of this coin.
However, along with the $10 support, the coin buyers still have the 200-day line, which maintains the bullish trend in NEAR price.
NEAR Price Gives A Decisive Break Down From $10 Support

Source-Tradingview
The NEAR price shows the fallout from the $10 mark with a massive red candle in its daily chart. However, the crypto traders should wait for candle closing to confirm the fallout, providing a selling opportunity to the $8 mark.
The Average Directional Index(45) shows a rise in falling trend momentum, supporting the price drop to the $8 level.
- Resistance level $10, $13.
- Support levels-$8, $6.4.


