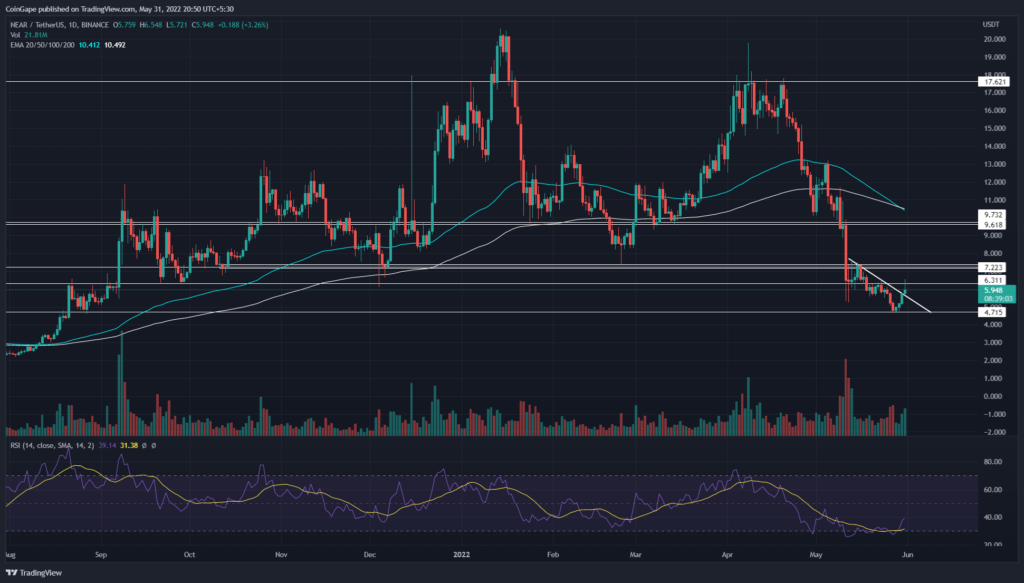
The Near protocol(NEAR) price downtrend slowed down near the $6 mark and yet reached a low of $4.6 on May 27th. However, the downsloping trendline carrying this downfall experienced a decisive breakout today, indicating a recovery opportunity for traders. The coin price currently trades at the $6 mark, with an intraday gain of 4.18%.
advertisement
Key points
- The NEAR chart shows a bearish crossover between100-and-200-day EMA
- The NEAR price breakout two-week long descending trendline
- The intraday trading volume in the NEAR is $935.5 Billion, indicating a 109.8% hike.
Source- Tradingview
The Near Protocol(NEAR) price has witnessed a significant downfall in the past five weeks, which sank it to a low of $4.6. Concerning the last swing high resistance of $17.6, the downfall devalued the altcoin by 73.2%.
Amid the recent uncertainty spread over the crypto market, the NEAR price gradually lowered using a descending trendline. However, the coin price bounced back from the $4.6 low encouraged buyers to breach the overhead trendline.
Trending Stories
The four consecutive green candles on the daily chart with increasing volume activity for every successive candle indicate high momentum recovery. Expecting a successful breakout and retest, the long traders would get their first target 32% higher at $7.2.
However, under a strong bullish scenario, the coin price should breach the $7.2 resistance.
advertisement
Conversely, if coin buyers failed to surpass the $7.2 resistance, the altcoin could consolidate between the mentioned resistance and $4.6 for a few sessions.
Technical indicator
For the last two weeks of lower low formation in price action, the RSI slope has maintained a stiff bottom near 26%. This bullish divergence indicates growth in underlying bullish momentum.
advertisement
The fast-moving 20-day EMA caught up with the Near Protocol coin may assist sellers in undermining the descending trendline breakout. Moreover, a bearish crossover between the 100-and-200-day EMA bolsters the same cause.
- Resistance levels- $6.3, $7.2
- Support levels- $4.7 and $3.5


