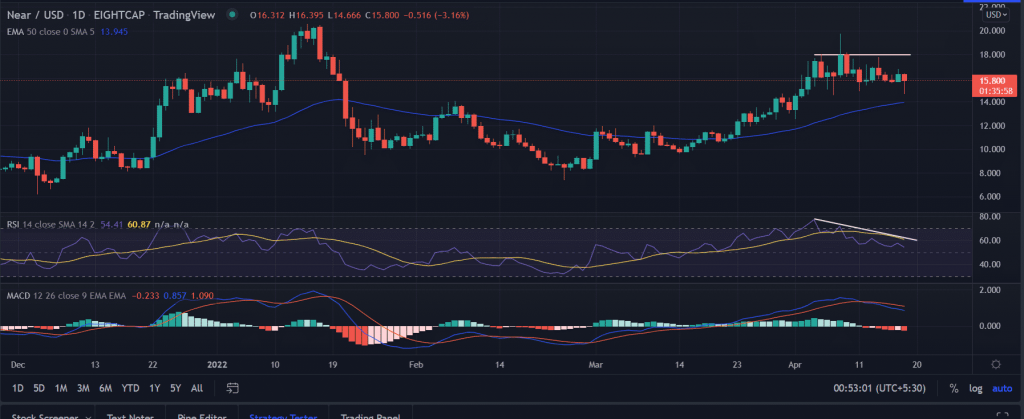
NEAR price trades lower as the fresh trading week begins. The price opened higher but failed to hold the sentiment as retraced lower. However, in the late U.S session, the price moved above $15.0 after a brief stint near $14.66.
- NEAR price continues to slide inside a short-term trading range.
- A daily close below $14.50 will set the base for a new directional setup.
- The bearish RSI divergence skewed in favor of the bears.
NEAR price recovers from day’s lows
On the daily chart, the NEAR price is trading in a short-term trading range of $14 and $18 with little deviations in between since April 4. Earlier the price surged nearly 160% from the lows made in February at $7.36. However, the bulls lack the conviction to carry forward the gains further.
Currently, the price hovers near the crucial support-turned resistance zone around $15.70.
The bearish RSI divergence since April 4 suggests the price could break $15.70 amid intense selling momentum. If that is the case, the first downside challenge would appear for investors at the 50-day EMA (Exponential Moving Average) at $13.94.
A break of the mentioned level will trigger a fresh round of selling in the asset.
Trending Stories
On the contrary, in an optimistic case, the NEAR price could extend the run-up and tag the recent swing highs at $19.74.
advertisement
The reason we are giving the bullish argument is the formation of the ‘hammer’ candlestick pattern. This could reverse the prevailing bearish sentiment in the price. Further, supporting the bullish outlook is the momentum oscillator, the moving average convergence divergence that still holds above the midline with a neutral stance.
In addition to that, an acceptance above the upper target investors would pull up their sleeves to catch the next upside destination at $20.0


