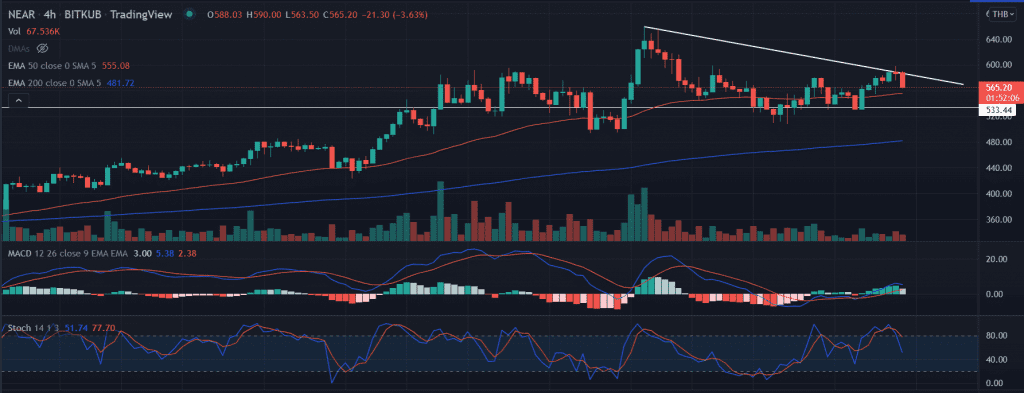
NEAR price manages to print gains but failed to sustain near higher levels. The price witnessed handsome gains over the past two weeks after bottoming out near the $23,000 support zone. However, after testing the 2022 yearly highs at $660 the price was retraced in the recent price action.
- NEAR price trades with a positive bias but retraces from higher levels.
- A break below the 50-day EMA on the 4-hour chart would amplify the selling towards $520.
- The momentum oscillators remain neutral warning of aggressive bids.
NEAR price moves downside
NEAR price set a range extending from 580 to 520 after being rejected at swing highs. The price created a swing low near $510 on April 5 and rallied 3-$ to be rejected by a resistance barrier at $0.89. Since then NEAR has swept below $560.
On the 4-hour chart, the price remains pressured near the ascending trend line from the highs of $660. Further, the formation of a ‘Doji’ candlestick resulted in a quick retracement in the price.
Now, a break below immediate support placed at the 50-day EMA (Exponential Moving Average) at $555 then it could intensify the selling toward the horizontal support zone at $530.
Intense selling pressure could further drag the price toward the low of April 1 at $423.
Trending Stories
On the flip side, if the price manages to hold support around $533.0, then a bounce back is expected toward the psychological $600 level.
The price surged nearly 170% from the lows of $243 made on February 24.
As of press time, NEAR/USD trades at $565.89, up 0.71% for the day.
Technical indicators:
MACD: The moving average convergence divergence made a turn toward the midline with a neutral stance.
Stochastic oscillator: The indicator turns toward the oversold zone, but still the market is far from overcooling.


