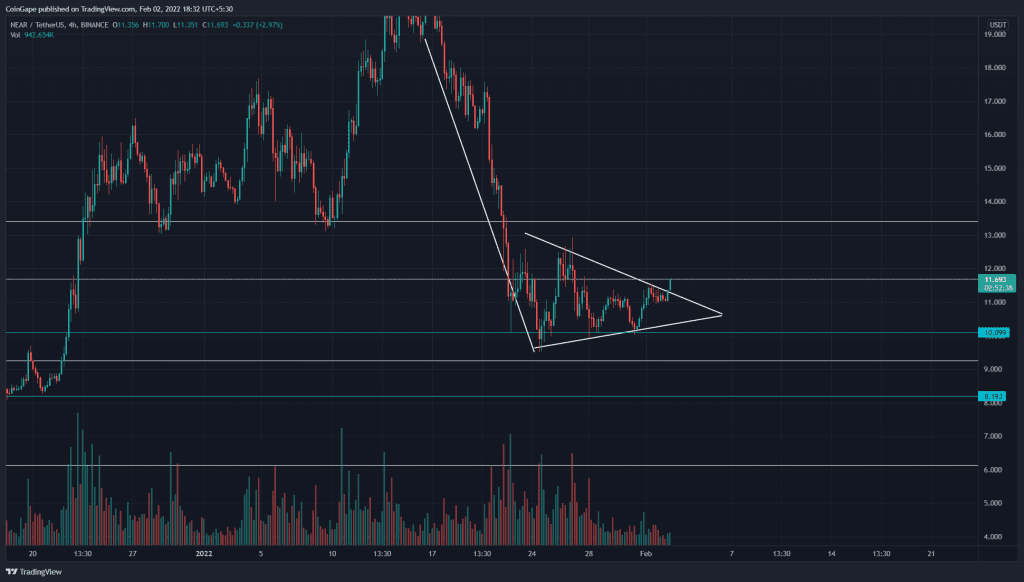
During January’s crypto bloodbath, the NEAR price lost two crucial support levels of $50% and 61% re-tracement level and tumbled to the 200-day line($10). The buyers managed to hold this support resulting in a tight consolidation for the past week.
Key technical points:
- The NEAR chart shows strong demand at 200-day EMA
- The intraday trading volume in the NEAR is $4.9 Billion, indicating a 27% fall.
NEAR Price Offers Bullish Breakout From Inverted Pennant Pattern
Source- Tradingview
Inverted pennant patterns are bearish continuation patterns that allow sellers to build up enough momentum before they resume the ongoing down rally. The fallout from the support trendline signals the bear attack to charge towards the lower levels.
However, in rare cases, the bulls might turn the tables and breach the overhead resistance. If the NEAR price does the same, the alt will retest the $1.37 resistance, which is key resistance to begin a genuine recovery.
As mentioned in our previous coverage of Near price analysis, on January 24th, the NEAR correction rally tanked to alt to $10 crucial support. However, the sellers faltered near the 200-day support, displayed by lower price rejection candles. NEAR price escaping the narrow range should continue the following rally.

Source- Tradingview
The buyers tried to recover above $13.2 resistance, but the sellers defending this level rejected the NEAR price back to the bottom support. Since last week the price action has been resonating in a narrow range, preparing for its next big rally.
The NEARUSD pair trading above the 200 EMA maintains an overall bullish trend. However, the other EMAs(20, 50, 100) would provide sufficient resistance to buyers.
The current consolidation triggers a bullish crossover in the Daily-Stochastic RSI indicators. The K and D lines rallying higher indicates the bulls are slowly gaining momentum.
- Resistance levels- $11.65 and $13.1
- Support levels- $10 and $9.1


