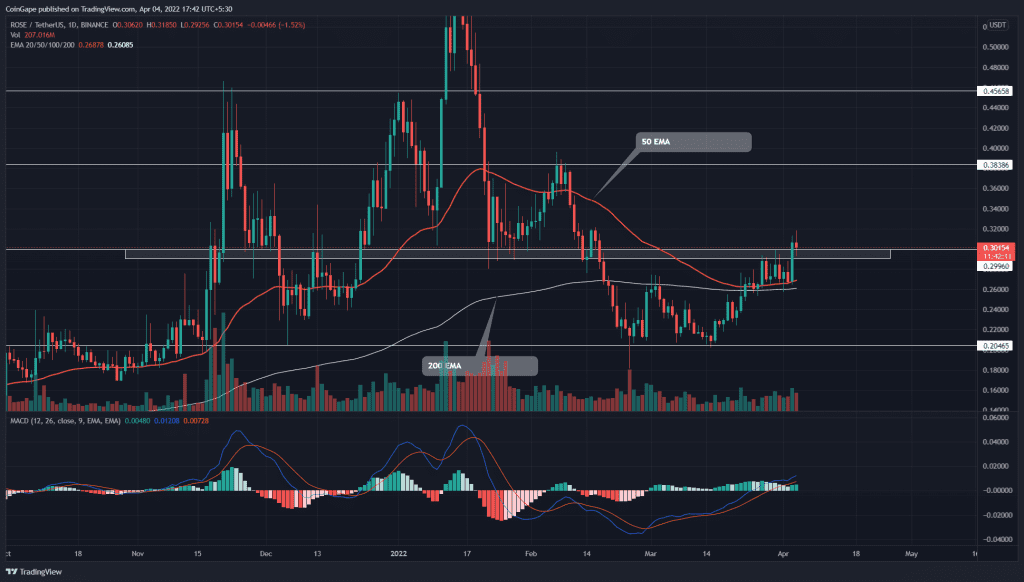
The Oasis Network (ROSE) price signaled the end of its assumption phase when the buyers breached the overhead resistance of $0.38. The altcoin showcased 45% growth in the last three weeks and provided another breakout opportunity if the price sustains above $0.38.
Key points:
- ROSE chart shows the morning star candle on the monthly time frame chart
- ROSE price provides a bullish breakout $0.3 psychological level
- The intraday trading volume in the Oasis Network token was $244 Million, indicating a 171% gain
Source- Tradingview
On March 15th, the ROSE price retested the January bottom support at $0.2. The following bullish engulfing candle validated that the traders were accumulating at this dip and triggered a new recovery phase.
The rising bullish momentum drove the altcoin by 34%, hitting the $0.3 mark. The sellers attempted to stall the bullish rally below this resistance, resulting in a minor consolidation last week.
However, during the recovery phase, the buyers reclaimed a cluster of several EMAs(20, 50, 100) which supported the price by 14.4% on Sunday. This massive green candle sliced through the overhead ceiling and provided a weekly closing above $0.3.
Today, the ROSE chart shows a Doji-retest candle hovering above the breached resistance, with an intraday loss of $1.5%. If buyers defend the new flipped support during the week, the upside rally could surge 27.75% to $38.8.
However, the bullish thesis will be invalid if sellers force a candle closing below the 200-day EMA.
Technical indicator
The downsloping 50-and-200-day EMAs are now moving sideways, indicating a considerable loss of downside momentum. Moreover, the rising 20-day EMA triggers a bullish crossover with 200 EMA, suggesting the buyers would gradually take the lead.
The MACD indicator was nearing a bearish crossover during last week’s consolidation. However, the breakout from $0.3 prevented the=is bearish signal and kept the bullish sentiment going.
- Resistance levels- $0.336, and $0.38
- Support levels- $0.3 and $0.26


