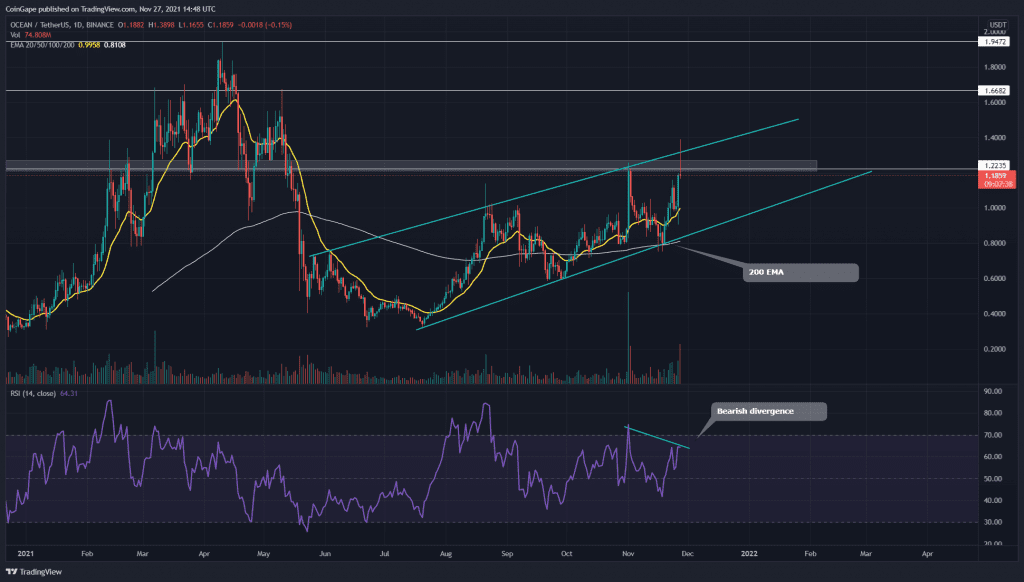
The recovery phase in the OCEAN token is going reasonably well. The technical chart shows a steady uptrend of new higher highs and higher lows. This structure has made an excellent bullish known as a rising parallel channel. Check out where the trading opportunity lies.
Key technical points:
- The OCEAN token displays a bearish shooting star candle at $1.22 resistance
- The intraday trading volume in the OCEAN token is $226.6 Million, indicating a 326.8% gain
Source- OCEAN/USD chart by Tradingview
The OCEAN token price is resonating within a rising parallel channel pattern in the daily time frame chart. This pattern has been leading the bull since late July ‘21, providing some excellent trading opportunities to traders with know target levels.
Currently, the token price is experiencing strong rejection from the resistance trendline, displayed by a long wick shooting star candle. In idle conditions, a bearish reversal from the overhead trendline should lead the price to the bottom one.
The crucial EMA levels(20, 50, 100, and 100) confirm an uptrend in this token where its price is steadily moving above them. The Relative Strength Index(63) maintains a bullish sentiment within this token. However, the RSI line also projects a bearish divergence, indicating the bears are trying to take control over the token.
OCEAN/USD Chart In The 4-hour Time Frame

Source- OCEAN/USD chart by Tradingview
The OCEAN token price shows a bearish reversal from the overhead resistance with an evening star candle pattern. The token has breached a traditional pivot level support(R2), providing an additional edge to the short-sellers.
Moreover, the crypto traders should also know that this channel pattern is quite famous for providing a directional fall when the price breaks down from the support trendline. Moreover, the weakness in RSI could be an early sign.
According to these pivot levels, the crypto traders can expect the nearest resistance at $1.2, followed by $13.8. As for the opposite end, the support levels are $1.1 and $0.93.


