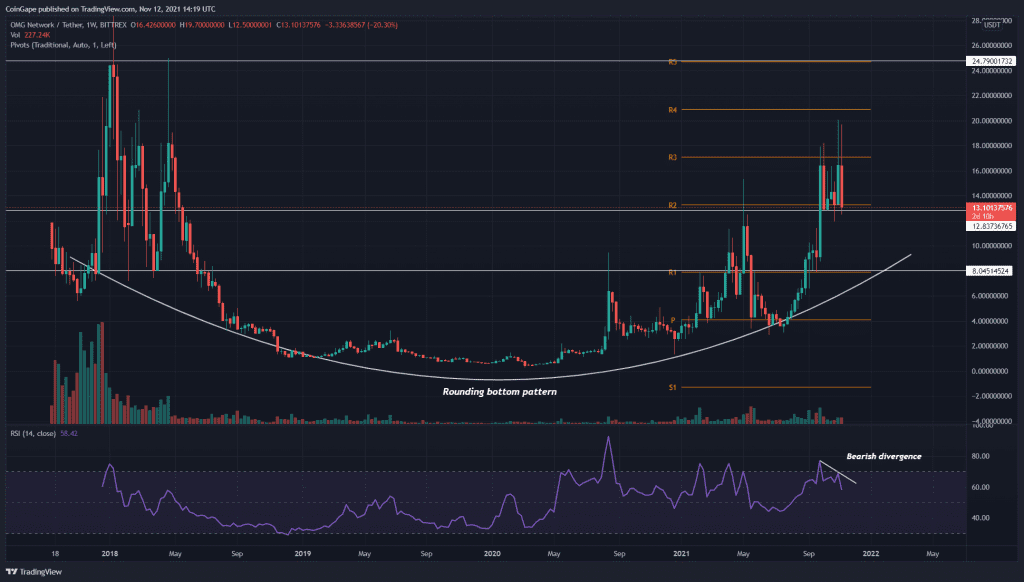
From a technical perspective, the overall trend of OMG/USD is bullish. However, the token is still trying to gain sufficient support from the $12.8 mark, which could be a stepping stone to initiate a new rally for the OMG token.
Key technical points:
- The OMG token forming a rounding bottom pattern
- The Weekly chart RSI show bearish divergence in its chart
- The intraday trading volume in the OMG token is $6.6 Billion, indicating a 147.5% hike
Source- OMG/USD chart by Tradingview
The Big picture shows the OMG token forming a Rounding Bottom pattern in the weekly time frame chart. This strong bullish pattern gives a clear image of a downtrend slowly turning into an uptrend.
On October 2nd, the OMG token managed to breach the crucial resistance of $13, indicating the price would continue to an uptrend. However, the token is still stuck in a retest phase and trying to obtain proper support from the broken resistance.
The traditional pivot displays great confluence with the OMG/USD weekly chart levels, and According to these pivot levels, the nearest resistance for this token would be at $17, followed by $20. As on the counter side, the support levels are $13.2 and later $8.
The Relative Strength Index(58) projected a bullish sentiment for this token. However, the RSI also revealed a bearish divergence suggesting some weakness among the market buyers.
OMG/USD Chart In The Daily Time Frame

Source- OMG/USD chart by Tradingview
Today, the OMG price showed a sudden price drop, with a giant red candle in its technical chart. This token shows a 24.5% loss in its intraday session and has plunged to the crucial support of the $13 mark.
For the past one month, the token has been trying to obtain proper support from this level. Moreover, the daily chart still has the 100 and 200 EMA lines that can help the price to hold above the $13 mark. If the price shows proper sustaining above this level, the uptrend could provide a target to $20 or $25 mark.


